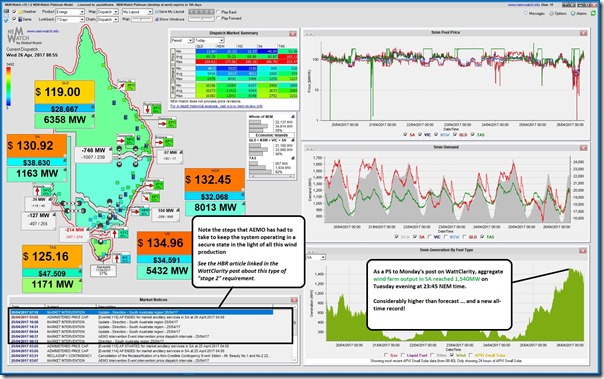
A quick PS to Monday’s article with the following observation from NEM-watch this morning highlighting how aggregate wind production peaked up at 1,540MW last night at 23:45 NEM time.
Note, for those who are confused by electricity industry terminology, that a “megawatt” is a rate of production, not a quantity (Quantity is expressed in MWh at this level). One “watt” is the same as 1 “joule/second” – so 1MW = 1,000,000 J/s
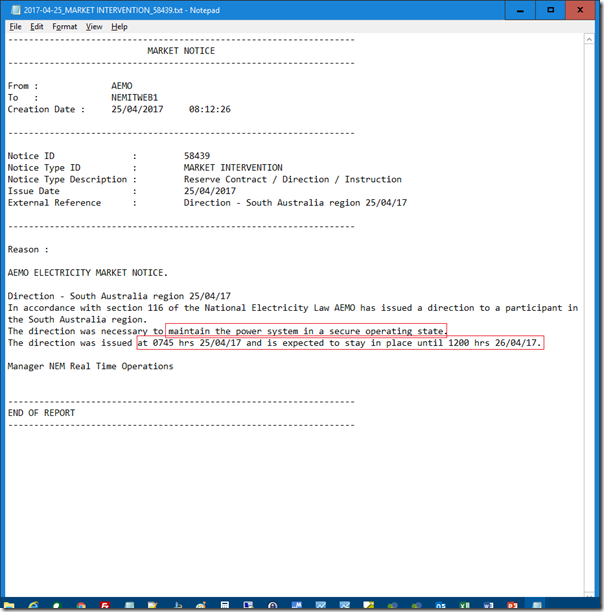
Note also (highlighted on the image) the Market Notices issued by the AEMO to broadcast that they have had to direct market participant operations in order to keep the system in a secure state, coincident with the windy conditions. Here’s the first one, issued at 08:12 yesterday (Tue 25th April), which indicated the view that the direction would remain in place until 12:00 today:
No more time to delve into the AEMO Market Interventions within the SA region currently… [it’s presumed that these might have something to do with windy conditions, but not confirmed until more detail is known].


The direction would have been to ensure two large synchronous generators were online. As Pelican Point was offline, and only one TIPS ‘B’ unit bid in to the market, I believe the direction would have been for AGL to start a second Torrens Island “B” unit. The minimum requirements for online synchronous generation have been published by AEMO previously but I couldn’t find the link.
Ian
The initial direction very early on Tuesday morning was for Hallett GTs (8 units) to start. These ran until early in the afternoon when a second TIPS B unit came online, again directed by AEMO.
The paper on minimum synchronous generation requirements in SA is at this link.
Allan
Ian – Allan O’Neil has posted more here today:
https://wattclarity.com.au/2017/05/more-about-wind-output-and-aemos-intervention-in-south-australia-25-26-april/
Was any wind power curtailed or was the surplus all exported to Victoria?
Ben – Allan O’Neil has posted more here today:
https://wattclarity.com.au/2017/05/more-about-wind-output-and-aemos-intervention-in-south-australia-25-26-april/
What impact has resonance on grid stability? Had a look at this guys video where he states that integrating solar and wind into a grid has serious issues. Thought you electrical engineers could explain it to us laymen?
https://www.youtube.com/watch?v=gJtv7gkuh1s
ardy – Allan O’Neil has posted more here today:
https://wattclarity.com.au/2017/05/more-about-wind-output-and-aemos-intervention-in-south-australia-25-26-april/
Wind power in SA tends to peak strongly at night, probably due to “gully winds” in the hills near Adelaide, where most of the wind farms are located, but it will still drop dramatically during heatwave afternoons, no matter how many wind farms are added. Wind power is SA has killed the concept of baseload, without providing much in the way of firm heatwave capacity, maybe there are some benefits that compensate for those terrible characteristics.
You should do a follow up for the effect on the NEM of lack of wind in NEM in recent weeks – zero wind generation in the NEM as I write this (with some sites showing negative?). I am not anti-wind but it has seen some radical pricing with no wind in recent weeks post Hazelwood closure.