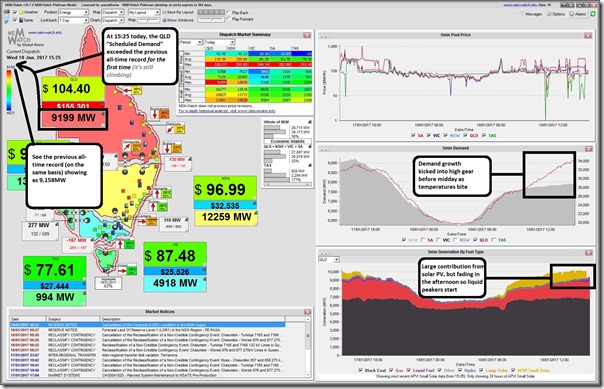
Otherwise focused today but it is worth noting that the Queensland region demand today has exceeded the previous all-time record – and, at the time of posting, is still climbing into a very hot afternoon.
Here’s a snapshot of NEM-Watch from 15:25 today showing the Scheduled Demand dispatch target for Queensland at 9,199MW:
Twenty-five minutes later (at 15:50) the demand had climbed further to 9,300MW – which was the high point at the day at the time of posting (but fully expected to be eclipsed in the next hour or two)
1st Update
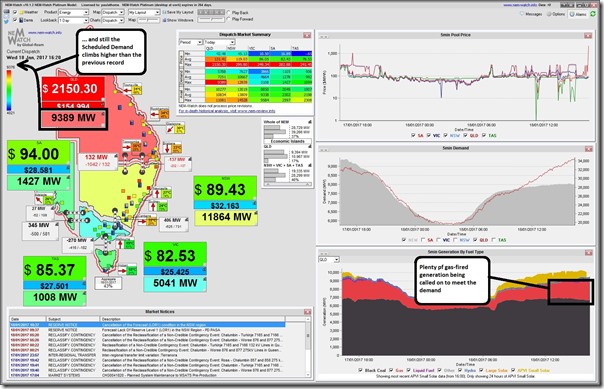
By 16:20 we see the QLD demand had reached 9,389MW (so >230MW higher than the previous all-time record):
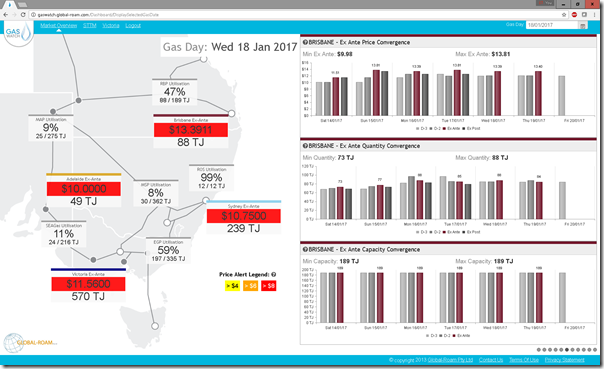
I’ve noted on this snapshot how there’s plenty of gas-fired generation supply being required to meet demand. This is one of the reasons why the gas price at the Brisbane hub has hit $13.39/GJ for today – as shown in our GasWatch product:
2nd Update
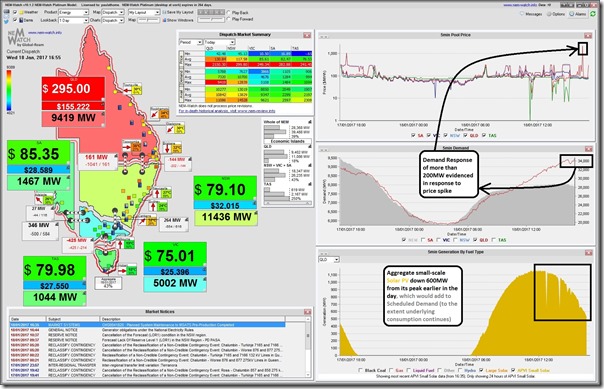
At 16:55 we see the QLD demand had climbed further to 9,419MW:
Note two points annotated on the NEM-Watch image:
1) We see that (responding to Lucas’ question below) afternoon solar PV injections declined by about 600MW off the peak so (to the extent that underlying consumption has continued – which we have good reason to believe is the case, given the temperature) this will have added to the “Scheduled Demand” AEMO has to dispatch generation to meet; and
2) We see approximately 200MW of Demand Response (of the spot-exposed type, presumably) responding to the price spike above $2000/MWh seen in the price trend chart.
At 17:00 we see the QLD demand at 9,477MW (the highest thus far, and more than 300MW above the the all-time record leading into the day).
If time permits, I might update further later…


Hi Paul,
Prior to Solar was this as high? What effect has solar had today?
Lucas.
See 2nd update above, Lucas
Great to see PV heavily utilised and reducing the carbon emission through most of the day, certainly the only bright spot. Such a shame most of the generation was through coal.
Hi Paul
On a half hourly basis the scheduled demand peak looks to be 9369 MW. This is about midway between AEMO’s 50% and 10% probability of exceedance forecasts for this summer, and more than 400 MW higher than the previous high in 2010 (also on 18 Jan – how about that!).
An interesting point of comparison is that the 2010 peak occurred in the half hour 14:30 – 15:00 (trading interval 30) while yesterday’s was for half hour 18:30 – 19:00 (trading interval 38). This shows how solar has – by reducing scheduled demand during the sunlight hours – pushed the time of system peak to much later in the afternoon. In 2010 scheduled demand was over 500 MW below its maximum by TI38, so had the same underlying consumption pattern applied yesterday, in the absence of solar you might have seen a half hourly demand approaching 9900 MW!
Actually 18 Jan 2010 wasn’t the highest half hourly scheduled demand for Qld prior to yesterday – that was surpassed by 9105 MW on 1 Feb 2016, my mistake 🙁
But the points about later time of peak and maybe another 500 MW of demand in the absence of solar PV still stand.
And this is probably labouring the point, but on first inspection someone might look at the 6:30-7:00pm peak, with solar PV producing virtually nothing by that time of day, and say “well, solar is doing nothing to reduce peak demand”. However this is incorrect because in deferring the time of scheduled demand peak, solar PV has moved that peak to a time of day when underlying consumption has fallen (ie some industrial / commercial load would have reduced by then), leaving a lower maximum to be supplied from scheduled generation.
But once the scheduled peak has been consistently shifted to that time of day it is true that additional solar PV capacity will not further reduce the size of that peak.
One thing AEMO seems to neglect to do is adjust actual peak demands for weekend reductions, there are many holidays as well at this time of year, so its quite possible that previous years would have had similar demands if the previous heatwaves had fallen on working days.
The same thing happens with wind power, once it gets “substantial” it pushes times of high peak demand on non-wind sources to wind lulls, and ADDITIONAL wind farms have very little effect on those peak non-wind demands. South Australia passed this point a few years ago.
I think they call it ‘potential stability issues’ in the diplomatic corps-
http://www.abc.net.au/news/2017-01-20/blackout-investigation-puts-power-import-plan-on-hold/8195394