On Thursday 2nd April, just prior to the Easter long weekend, I was fortunate to be able to attend an “Energy Express” seminar hosted by UQ Energy Initiative and the Global Change Institute – at which Professor Paul Meredith presented on the “Gatton Solar Research Facility”.
Though not as large as the Nyngan solar power station, which opened recently, this one is also opened recently to add to a pre-existing portfolio of solar facilities at UQ that have been developed to assist in meeting a number of coincident objectives, including:
1) To assist UQ achieve some ambitious carbon reduction targets;
2) To assist in energy procurement for the university; and
3) To provide facilities for “learning via doing” enabling various disciplines to work together in a systemic way in areas relevant to where society is headed for the future.
Professor Meredith covered a broad range of information during the talk, but one thing he noted stood out for me – and, I thought, would be of interest to some our readers as well.
The following is my recollection of these particular points so, if there are any mistakes or omissions, please blame my memory and not Prof Meredith (for the benefit of our other readers, feel free to point these out below).
At Gatton there are three different types of solar PV technology deployed (by First Solar, in this case):
Section 1) The bulk of the facility is “standard” fixed solar panels;
Section 2) There is a smaller share of the “off-the-shelf” single axis tracking system; and
Section 3) UQ has, in conjunction with its partners, installed a “first of its kind” dual axis tracking system to ensure optimal alignment of each panel in this section
With reference to the access provided here to the output data collected from the Gatton facility, I have copied in three static images that illustrate the particular point that caught my attention:
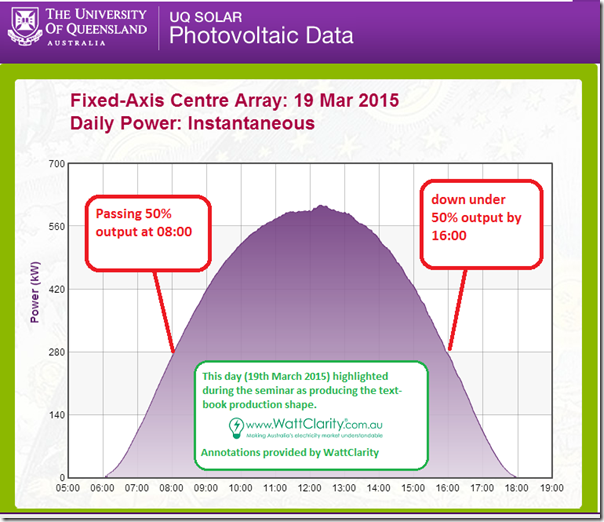
1) Production shape for the fixed-axis array
Prof Meredith highlighted 19th March 2015, which appears to be only 13 days after the plant came online, as the day where he’d seen the text-book production shape for the solar array:
Of the three banks of fixed-axis, I have selected the centre array.
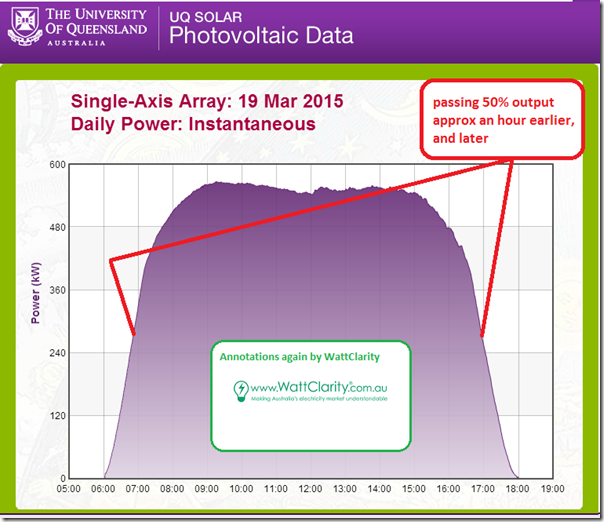
2) Production shape for the single-axis tracking array
Next, Prof Meredith highlighted the different production profile apparent when looking at the single-axis array:
A “fatter” shape is clearly evident, which results from the ability of this array to change inclination to follow the sun’s path from east to west across the sky.
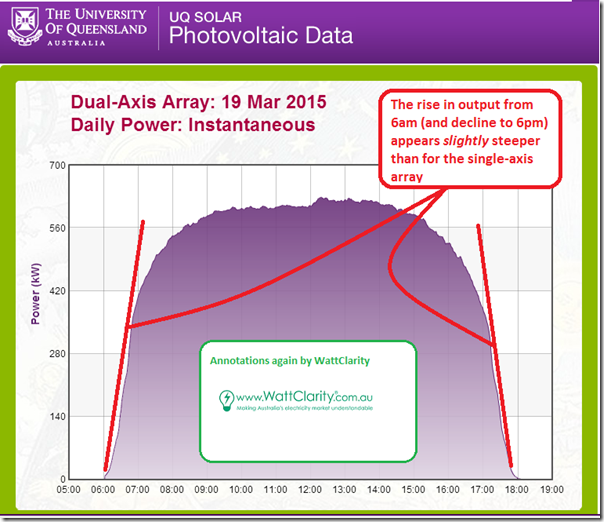
3) Production shape for the dual-axis tracking array.
Extending the process further, Prof Meredith explained how UQ and its partners had implemented a “first-of-its-kind” dual axis array with a tracking system designed to maximise the output of the array at any given point in the day.
The improvement in the shape here is not as marked (as from the 1st to the 2nd image above), but there does appear to be a higher capacity factor achieved.
* Referring back to the title of this article “Benefits of tracking systems in solar PV” you will note no reference (until now) of the costs involved in their installation. My memory is a little vague here, but I think it was mentioned that the cost of the dual axis tracking array was something like three times the cost (per Watt installed) of the standard fixed-axis array.
As we’ve noted on WattClarity recently, demand in Queensland is peaking later and later in the day – including well after the 6pm sunset time implied in the charts above. Hence it does make it look difficult to achieve a commercially attractive payback on the fitting of tracking systems to increase the capacity factor beyond what’s possible with fixed axis arrays.
It does, however, show evidence of the potential network benefits of west-facing (e.g. residential) solar arrays – though, I would suspect, this might have the countervailing impact of reducing the capacity factor possible with the traditional north-facing inclination.
Perhaps those more knowledgeable in the solar space might like to help me understand better by adding comments below?


Dual axis tracking systems look amazing, but the cost increase far outweighs the improved energy harvest. The improvement in energy harvest is also affected by latitude. It only becomes appreciable at higher latitudes – talking >35N or S. There is a significant increase in BOS for dual axis tracking – motors, controllers, comms within the plant, not to mention the foundations. When the modules were expensive it was a great idea, now that modules are cheaper, the most cost effective way to increase energy production is to put in more fixed modules. Similar arguments can be used to justify preferencing flush mounting vs tilt brackets in residential installs.
Single axis is a lot simpler mechanically so the economics are subsequently a bit softer. The increase in energy harvest is reduced too – I’ve not had much to do with single axis trackers, so I’m not sure where the line falls.
The graphs are from the 19th – I’m not sure what the tilt angles of the fixed and tracking systems are, but if they’re close to latitude then these graphs will be of almost the ideal day – close to the solstice. Comparison of the peak output / installed capacity of each system will be interesting at the end of June. The capacity factor of the dual axis should remain relatively stable over the year, the other two will vary quite a bit.
The arguments for or against west vs north orientation are heavily dependent on the tariff and the site – unless afternoon tariffs are much higher or the west facing roof is the only suitable roof and its a choice between some solar and barely any, west facing will always result in a fairly large reduction in energy harvest. At typical residential roof slope it’s around 25% reduction from ideal. This reduction is less noticeable/important at low tilt angles (say 15 degrees or less), which does allow for a lot more freedom on large commercial/industrial roofs, and can allow for very high coverage ratios on space constrained ground systems.
The relative cheapness of modules may allow to offset this drop in output through increased capacity, but with no time of use tariff or a flat load profile, the timing of the solar peak is a bit irrelevant so you go for the best $/kWh.
Also, while orienting to the west (or east) does shift the timing of the peak, it’s not really noticeable until you get to really silly tilt angles and start to lose a lot of output due to atmospheric absorption and a lot of space due to mutual shading.
Sounds a good idea. Any idea when the costs will come down enough so that this technology will
be on peoples houses in Queensland? Or will the cost always be too high do you think?
Any idea what the following is (approximately)
Dual Axis Total Energy Over typical March day
——————————————————————————- = 120%, 110% ????????
Optimal Fixed Total Energy Over typical March day
Keep up the good work!
Dear Paul
Very good response from Nathan. Its true the best PV outputs for fixed tilt are often recorded around the equinox – in Melbourne at least, this is often in October/November or April, when the elevation of the panels allows the highest levels of radiation captured by the plane of the PV array.
The calculations for tracking are pretty simple – is the additional capex of the installation of tracking exceeded by the additional value of energy on an NPV basis? You would add to this cost the maintenance and risk of downtime involved with tracking. If you follow some of the bigger installations you may see that the developers have already sone these sums and decided not to track.
On the residential PV side, the depressingly small feed-in tariffs in Victoria have led installers to so something weird – orienting half of the modules east and the other half west. This is an export minimisation strategy as it pushes the generation into the morning and evening peaks and minimises export typically seen in the middle of the day. It doesn’t give you the best kwh harvest but rather the best $ harvest. So PV policy can give us some odd PV architecture. Note don’t try this by connecting these arrays together – they should have separate inverters!
Could a simplified tracking system work with floating arrays, such as the recently-opened unit a Jamestown in South Australia ? A whole chain of floating panels mounted at the latitude angle could be moved between NE, N and NW during the day by a relatively simple automated pulley system. The UQ tracking systems would be expensive because they are holding the entire weight of the panels. If instead that weight is floating, a much simpler system could be used.