Unfortunately I can’t make it to Clean Energy Week 2014 this week in Sydney – it’s certainly a topical time in the industry with respect to renewables, and carbon.
Amongst other things, we’re working to finalise the “Power Supply Schematic” Market Map update for 2014 – which shows (after a gap of more than 3 years) a very different generation development landscape.
Compared with several years ago (before concerns about declining demand had really sunk in) the challenge now is to identify which (of the hundreds of announced projects identified) are still being worked on.
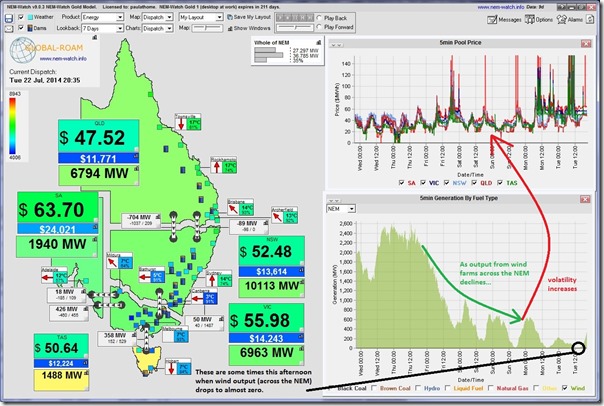
Taking a quick look at NEM-Watch this evening, I noted this very marked pattern of reduced wind farm output and increased market volatility.
Now, our readers should keep in mind the adage that correlation does not always equate to causation.
In this case, it does make sense that the potential for volatility (from generation bidding at SRMC significantly above zero) is more likely when wind farm output is low – all else being equal. It should be noted that this is probably not the only contributing factor.
We did post this quick snapshot on Monday highlighting some volatility.
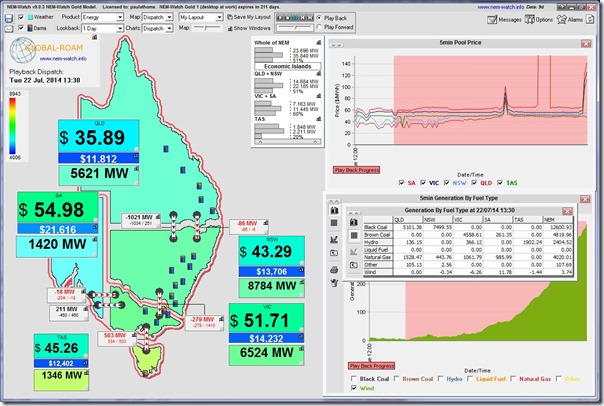
What was remarkable in the chart above were some times when wind farm output dipped to almost zero – here’s Playback of one such occasion at 13:30 this afternoon, when wind production stilled to only 3.74MW summed across the NEM:
The table highlighted in the snapshot shows 11.78MW and what might be some SCADA reading errors at low load netting off that total for NEM-wide.
Note that the prices were fairly modest at the time – with the spikes tending to be more closely aligned with morning and evening peaks in winter demand.
Another reminder (following this earlier back-of-the-envelope postulating a maximum of 37%) that complementary technologies are going to be necessary if wind farm output is going go well beyond that level, leaving the cost question to the side for the moment. Storage is increasingly talked about, but demand response might also play a part – not to forget the existing fleet of thermal assets (assuming that generators can still somehow earn a commercial return and don’t fall like dominoes).
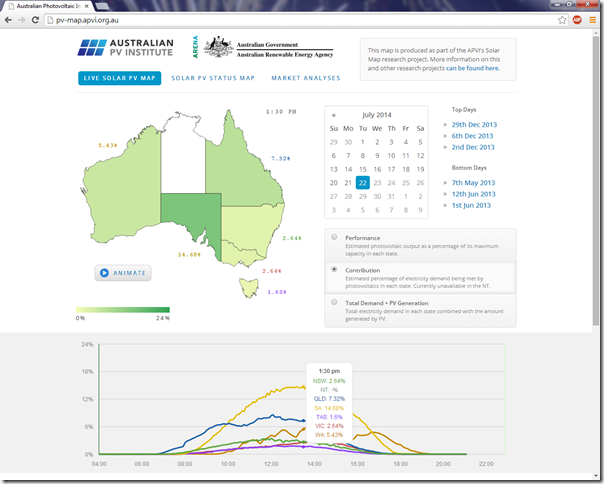
A quick look at the (ARENA-sponsored) APVI solar production tool shows that there was a contribution from solar, but (also) not as high as it’s been on other days in some regions.
I know that it was cloudy today in Brisbane
Food for thought for the delegates at Clean Energy Week…


Most of the volatility was in the South Australian market, which has the highest penetration of wind capacity, and has seen the greatest off-lining of thermal capacity. We could expect this volatility to reduce once the Heywood inter-connector is upgraded, and provide another 190 MW of transfer capacity to a much larger market. But this depends on whether the extra capacity is used to provide a relatively constant import or 190 MW, or whether the capacity is kept to smooth out the price peaks. It can’t do both at the same time.
To me the surprises in these data are
– why do the thermal generators (such as Torrens Island) not seem to be using the forecasts of wind power production to set the number of generation units kept on the boil ?
– do the generator operators not trust the forecasts ?
– spikes in the Tasmanian market should be easy to smooth out with some experience in managing quick-response stations such as Reece, unless the bidders want to intentionally generate price spikes
The next point of interest in volatility will be when the LNG exporters start bidding at the end of the year and gas prices start to climb. It would make it much more expensive to keep generation units at Torrens Island boiling ready for price spikes.