As a cool change arrived in Victoria and South Australia today, we see that the debate about the nature of Australia’s National Electricity Market (NEM) and the various renewables, carbon, demand response and network enhancement schemes (amongst others) has, once again, heated up.
Solar made a contribution
We read with interest Kerry Burke’s reminder today that solar PV played a useful role in ensuring that the demand peaks over the past hot week in Victoria and South Australia were lower than they might have otherwise been.
If I am reading Kerry’s figures correctly, there was a 448MW reduction on a combined, but not simultaneous, peak figure of 14,224MW in Native Demand across the 2 regions. This represented a 3% reduction.
From a standing start only a couple years ago, this shows that solar has grown to provide a not insignificant contribution that, as Kerry has noted, forms part of a fleet of generation capacity that has grown significantly more diverse* in the past 10 years than it was at the turn of the century.
* The merits, and costs, of this diversity are the subject of considerable debate at present – with it looking likely that this debate will continue for some time to come.
These numbers speak for themselves, though, in terms of the current scale of solar’s contribution, on the supply side of the market.
One of a number of a significant number of factors contributing
PV’s contribution to place downward pressure on Scheduled Demand (the demand that needs to be met by the AEMO in dispatching Scheduled Generators in the market) is one of this list of contributing factors we posted a couple of years ago, and that are still relevant today, in terms of why demand growth has been limited and has even been seen to be generally declining.
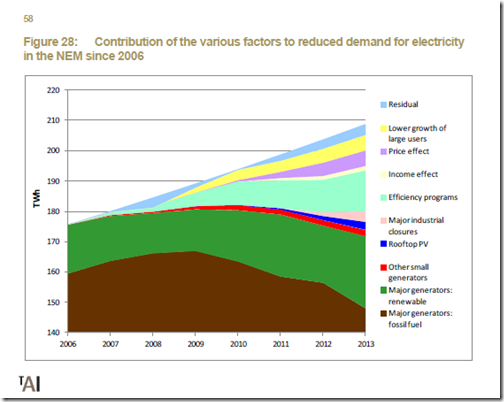
Interestingly, we note that Hugh Saddler has, more recently, contributed with this lengthier review of many of these factors, and some others, to the decline of average demand for energy in the past 8 years. Particular of interest was this chart which I have borrowed from this report:
It is important to keep in context that Hugh’s report was focused on average (not peak) consumption of electricity, and is referenced to “business as usual” assumptions about where demand might have otherwise been (in the absence of the contribution of all of these factors).
It does serve as a useful reference in any case – I am unaware of any other study, in the public domain, that has been prepared with the same (or better) level of rigour. If one of our readers does know of one, please let us know – either offline, or with a comment below?
Demand Response played a sizeable role in beating back peak demand
Also worth noting is the role that Demand Side Response (DSR) played in ensuring that demand was also lower than it might have otherwise been – though this needs to be a more subjective judgement because of the need to make some assumptions about what might have otherwise been the case (i.e. if the demand response had not been activated).
Both Greensync and EnerNOC, two aggregators of DSR in the NEM, were referenced in this article in the AFR during the week (with reference to the 10-20MW of DSR that EnerNOC activated for one of their clients, the retailer ERM Power). We know of other retailers who also have active demand response programs, though we don’t know how big they are:
That article also contained a reference to the stalled process of implementing the proposed (and contentious) “Power of Choice” reforms, and specifically the creation of a mechanism for incorporation into the NEM’s energy-only market design of the intangible commodity that’s been called “negaWatts” in other parts of the world.
Even in the absence of such reforms, we know that there is already a growing range of large industrial energy users who are helping to keep a lid on peak demand by providing demand response directly into the market (so not through intermediaries such as EnerNOC and Greensync):
These large industrial energy users adopt an approach (typically through a retailer of choice – but, on rare occasions, directly with AEMO themselves) of taking spot price exposure for the energy they consume (rather than having the cost & risk of price volatility smeared into a standard retail contract) and then physically mitigating the risk of the high spot prices by turning off when the price is high.
A significant number of these are clients of ours (using products such as deSide® and ez2viewAustralia to maintain visibility of the spot market price, and hence to trigger their curtailment decisions) whilst others we know of manage this risk through other means.
The scale of this contribution (in megawatt terms) is at least an order of magnitude larger than that noted as being activated for ERM Power during the week, and might be even larger (collectively) than the contribution noted for solar. This absolute contribution is harder to gauge, though, as it requires making assumptions about what might have otherwise been.
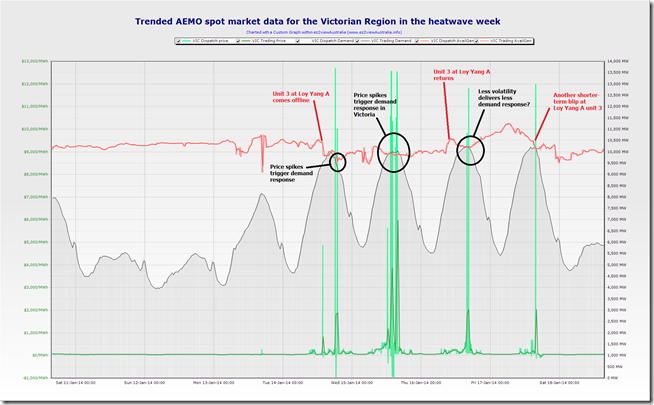
If we take a look at the following chart generated today from ez2view, we see a trend of key Victorian market data over the past 8 days up until and including this afternoon, annotated for a couple key events:
(CLICK ON THE CHART FOR A LARGER VIEW)
Particularly on Wednesday 15th January, it’s clear that we see a change in the shape of the demand curve in between the two significant spikes over this period, which might represent a reduction of 200MW-300MW in Victoria over that period. However such assessments are further complicated by factors such as:
1) The other hot days (Tuesday 14th, Thursday 16th and Friday 17th) all saw price volatility as well, which we know will have triggered some demand response for some of our clients sites in Victoria. Hence perhaps the demand shape on the four hot days might have otherwise looked more “pointy”, like was the case on Monday (again note that this is speculation, and would be very hard – if not practically impossible – to know).
2) On Wednesday 15th we also saw the AEMO announced that they might have to run the Reserve Trader – though we did not see any further notice on the day to say what was actually called on in that way, and have not had time to follow up, so can’t be sure that Reserve Trader was actually used. If someone does know, please comment below?
3) On Wednesday 15th there were certainly public calls for electricity usage restraint that would have had some effect.
no doubt there were other factors as well…
I don’t have time to do the same for South Australia but would expect to see another significant contribution, based on what we know of demand response in the region.
With the zonal demand data published by the mainland transmission companies and viewable through ez2view, we would be able to narrow in on particular load zones to further analyse the nature of demand response in specific locations around the NEM. Perhaps something for a later post…


A user with a steady usual load doesn’t even need to participate in the NEM pool in order to benefit from negawatts. It is a two-step process: (1) They write their PPA with their retailer at pool pass-through prices (plus network and other charges). (2) They enter a hedge with a retailer (can be same or different retailer) or other financial intermediary for their usual consumption profile. They will collect the high spot price from the hedge counterparty when they reduce their consumption below the hedge quantity. And if they don’t reduce, they are still hedged against the pool price. That is, you don’t need a Rule amendment, and you don’t need to play the pool, in order to get value for your negawatts.
Hi Graeme
Thanks for the added insights – some of our clients do a variety of hedging (all sorts of permutations, we understand) to back up their physical ability to curtail.
This also varies by season, and with their order book, etc…
Paul
Paul
Thanks for the article. I have looked at the SA demand and price curves for the hot days last week and they do show the same “jagged” peak you refer to in the article.
I know that some users that take spot risk have a staggered load shedding program with less essential demand being load shed at much lower spot prices than MPC, with trigger prices for least needed demand occurring below $1000, with other demand being shed at increasing price triggers – essential services stay on regardless. The challenge is to get the “essential; demand as low as possible – and some have found that this essential load can be less than 10% of normal demand.
Others install their own generation, still load shed and sell back into the grid and not only avoid the high rice events but contribute to the capital cost of their generation plant through the revenue earned from the market.
So there are number of ways to skin this cat!
Regards
David
Thanks for the added comments, Dave
Yes, we also know of people doing this – and there are, no doubt, others as well – some of whom probably keep their cards close to their chest as a piece of competitive advantage in their sector.
Paul