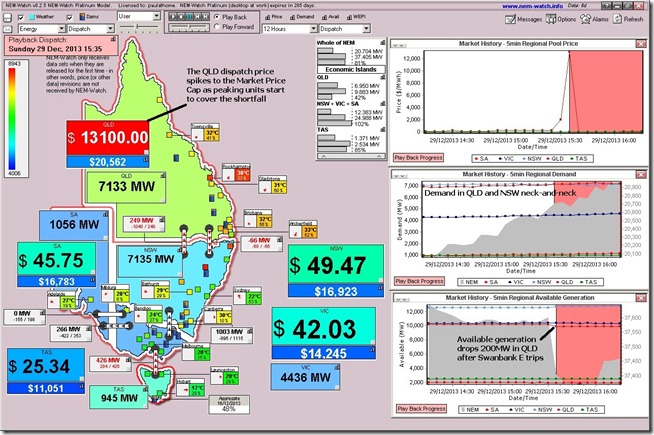
Here’s something you don’t see very often – in the attached snapshot from NEM-Watch running “playback” to rewind about an hour earlier to 15:35, we see that the scheduled demand in Queensland (7,135MW) was almost exactly the same as the scheduled demand in the much bigger region of NSW (7,135MW).
We can see that the QLD demand has been climbing through the day, whereas the NSW demand (by virtue of the very modest temperatures in the main population centres of NSW) is tracking at about half its all-time maximum demand level. Since this time, the demand in QLD has indeed surpassed that in NSW.
In addition, the scheduled demand in VIC and SA has barely moved out of their respective dark blue zones – partly because of the cool weather, but also higher outputs from wind farms has dragged down the scheduled demand that AEMO has to dispatch scheduled generators to supply.
{The price spike to the the Market Price Cap of $13,100/MWh shown has followed a trip of the Swanbank E power station shortly before the 15:35 dispatch interval}
For those contemplating our entries in our “Best Demand Forecaster in the NEM” competition, we note that the NEM-wide demand at the time recorded here has only just scraped past 20,000MW (so is less than 60% of the all-time record).


Leave a comment