When speaking recently at the All Energy 2013 conference in Melbourne, I speculated about three discrete ways that solar PV might be impacting on the broader energy market (positively, or negatively, depending on your perspective) – particularly with respect to what we observed happening in the Queensland region over summer 2013.
In the week just passed, we saw a return to volatility in the Queensland region, with:
1) Two price spikes on Monday (21st) evening,
2) Some excursions over Wednesday 23rd,
3) A spike to $13,100/MWh on Friday 25th at 16:25; and
4) Another spike to $13,100/MWh on Saturday (26th) at 18:50
Given this activity, I was spurred to continue with one aspect of this analysis.
In this post, I provide some further analysis of one of these three potential contributions.
1) Recapping what happened throughout Queensland in Summer 2013
Summer 2013 was the most volatile summer experienced in Queensland over the past 15 years (since the inception of the NEM).
For those who would like more detail about what happened over summer:
1) In my presentation, I provided a summary of outcomes, and some of the contributing factors – including the presentation of this animation of the events of Thursday 20th December 2012. If you’d like a copy of the slides from the presentation, please give us a call (+61 7 3368 4064) and let us know?
2) Throughout summer itself, we also posted numerous observations about what was happening on WattClarity;
3) For those who really want to understand the details, including the root causes, we prepared a detailed (100+ page) report discussed here.
2) Will increased solar PV unwittingly play into the hands of transient generator market power?
One of the observations made (by us, and others) over summer was the use of generator ramp-rate constraints to engineer price outcomes:
Give us a call if you’d like to understand the detail – in general terms, some generators can increase (or decrease) output faster than others, and this is a parameter that generators can change in their bid stacks (visible in software like our ez2viewAustralia).
By bidding in a certain way, especially with large changes in dispatch target demand from one 5-minute period to the next and transmission constraints, generators might have transient market power and so be able to achieve a transient spike in prices.
Given the increased roll-out of solar PV across Queensland (and more broadly across the NEM) and the variable nature of its output (dependent on solar intensity and cloud cover) we speculated that there might be emerging more opportunities for generators in the NEM to put the same strategies in place.
Please note, with respect to the following preliminary analysis
This preliminary analysis has been completed within the time constraints allotted and has not been thoroughly checked – hence it is possible that it may contain errors (i.e. it’s a blog post, not a scientific paper or commercial report).If you do see errors in what follows, please add a comment below, or let us know offline (tel +61 7 3368 4064) and we will endeavour to further investigate when time permits.
To understand whether this is, in fact, reality, we crunched the numbers looking at the pattern of Demand Delta (the change in Dispatch Demand Target from one DI to the next DI). We chose to start at summer 2009-10 as prior to that time the penetration of solar PV was negligible – though as you will see from the following, we probably should have looked at more historical years in order to ascertain the significance of any changes.
2a) Demand delta across all times
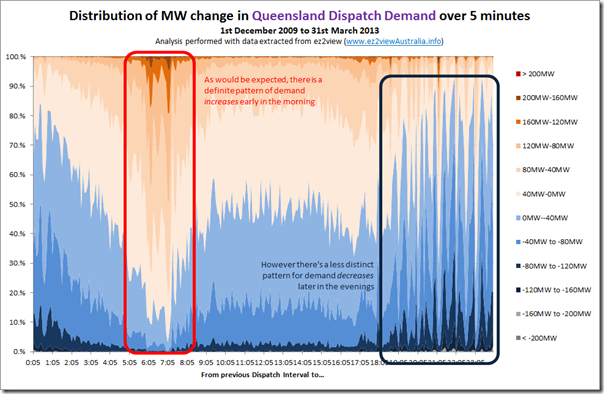
Taking all dispatch intervals from 1st December 2009 through until 31st March 2013 (a total of 350,496 data points, and spanning 4 summers) we see the following distribution of Demand Delta:
This starting point for analysis shows a number of points of note:
1) During the morning period there is a distinct pattern of demand increasing to meet the morning peak – with almost no instances around 07:00 (across all 1217 days studied) where the demand is seen to decline. This is largely as would be expected.
2) Over the evening period, however, when we would expect to see high incidence of demand decreasing, it is a more irregular pattern:
(a) It covers a wider period of time than is the case in the morning; and
(b) It shows specific dispatch intervals across the evening where there is a surprisingly high incidence of demand actually increasing*
(c) In a post specifically looking at solar PV it is worth noting that any patterns after around 19:00 (approximate time of sunset during summer) can’t be as a result of any solar factor.* This is particularly the case at 21:10, but is also the case at other times. The first explanation that comes to mind for this particular instance is the possible switching of off-peak electric hot water systems – we have not invested the time to check into this possibility, so perhaps some of our readers can let us know (below) if there are particular times when it might be being switched, as was the case in South Australia.
3) In between morning and evening, we see a pattern of roughly equal share of increasing and decreasing.
4) Looking across the day, the vast majority of demand delta lies in the range between a 80MW increase, and a 80MW decrease from one dispatch interval to the next – however there are a non-trivial number of cases where the demand change was greater than 200MW (in some rare cases 600MW up or down – though this would be due to trips of potlines at Boyne smelter).
Taking this same data set and focusing in on just the four summer periods (we’ll maintain our recent definition as December-through-March for completeness) and we see the following intriguing developments:
2b) Comparing incidence of “large” change in trading period bundles
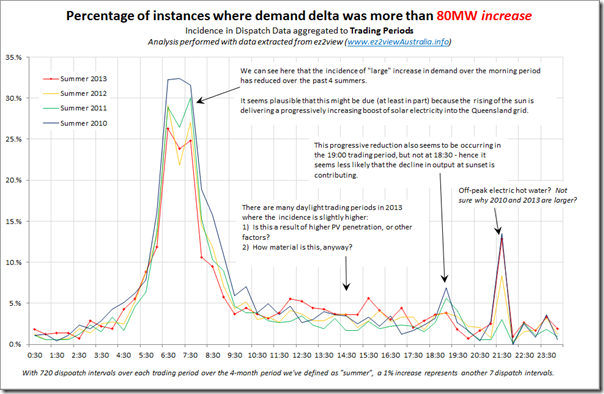
In the chart above we can see relatively few instances where the demand delta is greater than 80MW (up or down), hence we have selected this to represent a “large change”.
In the following chart we have highlighted, on a time-of-day basis, the incidence of increased demand greater than this 80MW threshold*.
* Note that we have not systematically correlated this threshold with instances through summer 2013 when ramp rate constraints were material in facilitating a price spike – hence it may be too high, or too low. This could be one piece of subsequent analysis.
It’s also important to note that “a number of planets had to align” over summer 2013 to create conditions where prices could spike. Hence a higher incidence does not guarantee higher volatility.
From this chart, we can see:
1) A definite decrease in the incidence of large increases over the morning period associated with the ramping of demand as work starts for the day (coinciding with the ramping of solar PV output as the sun climbs). Hence, the hypothesis above is true, then this would mean a reducing opportunity for generators to use ramp rate constraints to engineer price outcomes in the morning period (all else being equal).
2) During the daylight hours, we can see a slight increase in the incidence of large demand changes.
(i) Perhaps this is due to the variability of solar PV with cloud cover being more material as the installed capacity increases – but their could be other explanations(*). If it is due to solar PV, to some extent, then the above hypothesis might mean increased opportunity to engineer price outcomes during daylight hours.
(ii) * One such alternate explanation is that the summer 2013 was more volatile, and so saw a greater amount of demand side response activated than in other summers – the increased incidence might reflect this coming back to service after prices subsided (this has not been analysed).
3) We also see a number of other changes included as annotations on the chart.
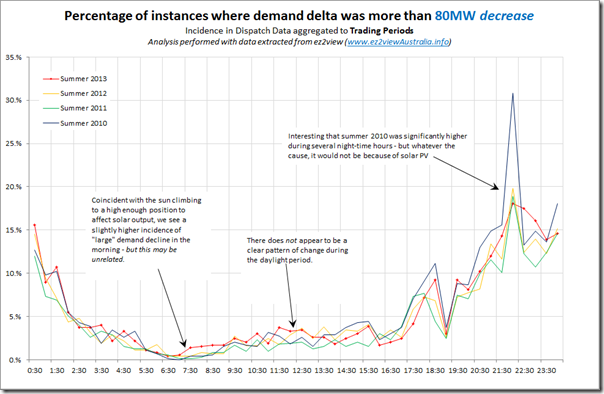
Turing our attention to large decreases in demand, we see the following chart:
In the morning period, we see a slightly higher incidence of large demand decreases (which might have something to do with solar PV). There is not a clear pattern through the daylight hours.
2c) Trending morning, day, evening and night
Next, we broke the day into four different time-slices based on the patterns seen above:
Summer Sunrise – which we defined as 05:00 to 09:00
Summer Sunset – which we defined as 17:00 to 19:00
Summer Day and Summer Night being the in-between times.Then for each of the four time blocks we trended the different distributions across all four summers to reveal these patterns:
i. Trend in Distribution for Summer Sunrise
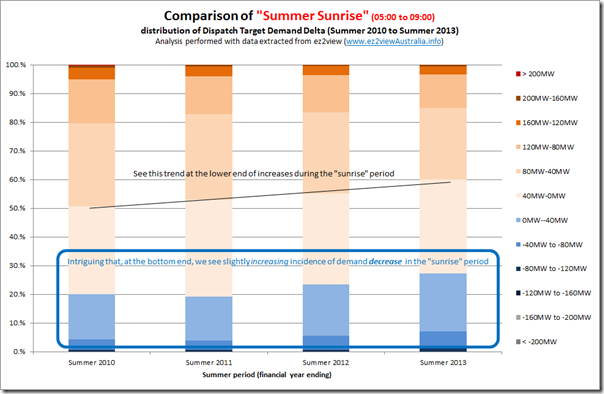
Using the same distribution blocks spread across the 400MW range, we see the following trend emerging.
It seems sensible that the rising incidence of solar PV (in conjunction with other new technologies & changes in electricity usage practice – such as these listed here) in the Queensland network might reduce the typical increase in scheduled demand seen by the wholesale market during the sunrise period.
If it is true that increased demand volatility plays into the hands of generators who can use superior ramp rates to affect price spikes, then this would mean that sunrise will increasingly have less opportunity for them (as noted above).
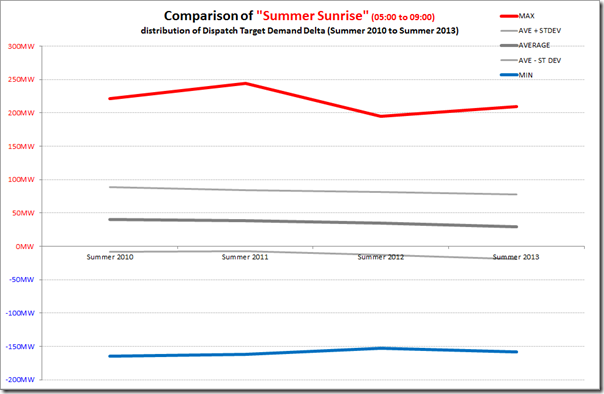
The situation over sunrise is also shown in the following view of the extremes for each of the four summers:
As would be expected, the average demand delta is for an increase – though it is intriguing to see this average trending down over four summers.
There is not a clear pattern observable at the extremes.
ii. Trend in Distribution for Summer Daylight
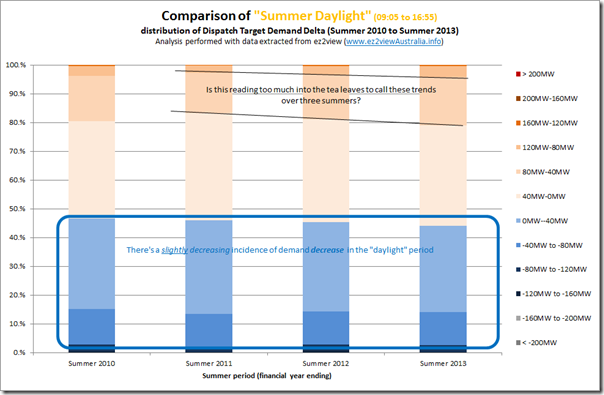
We then perform the same analysis for the “summer daylight” period – which, as noted above, we define as 09:05 through until 16:55 inclusive.
As shown on the chart, perhaps (and that is a perhaps!) there is the appearance of a trend towards an increased incidence of higher demand increases (i.e. an 80MW increase, or more) over the past 3 summers – but this does not match with what’s seen in summer 2010 (which had incidence higher than 2011 or 2012).
If this is emerging (and, again, that’s an “if”) then:
(a) It might be attributed to increasing incidence of solar PV (though there probably are other factors at work); and
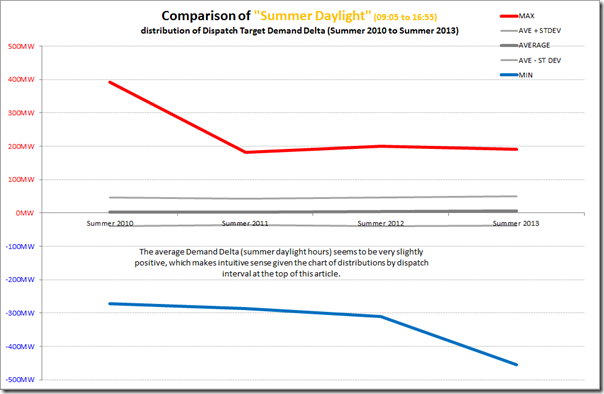
(b) It could be interpreted as meaning that there might be more opportunity for generators to utilise transient market power to achieve price volatility.In the chart above we suspect we should exclude the two 400MW outliers – believing that they are due to other factors, such as demand response or potline outage (however we have not invested the time to check this). If these were excluded, then any trend would be more modest.
We also see that the average demand delta during summer daylight hours tracks almost exactly at 0MW.
iii. Trend in Distribution for Summer Sunset
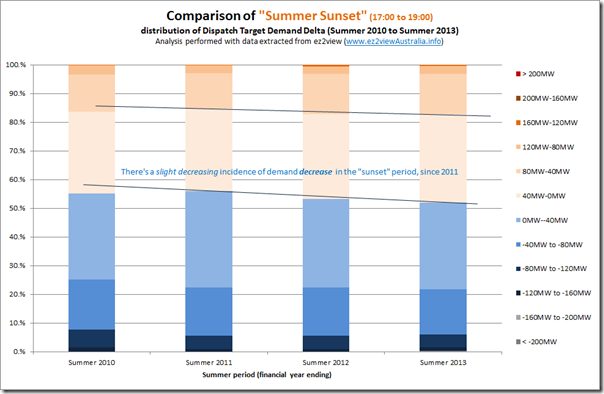
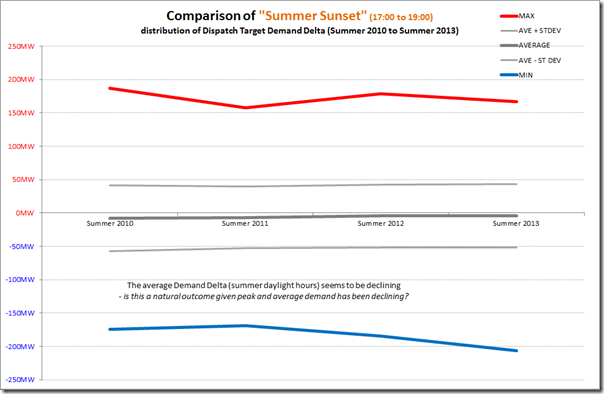
Looking at the sunset hours (which we’ve defined as 17:00 to 19:00) we see the following patterns:
As would be expected, there is a greater incidence of demand declining than increasing – however there appears to be a slight trend of this coming more back into balance in the past 3 years (i.e. a growing incidence of demand increasing).
The trend of the extremities does show that there appears a trend towards increase in the maximum decline in demand.
The average demand delta over this period is (slightly) below 0MW, as would be expected (given the time of the day).
As can be seen above, perhaps some faint trends can be seen in the period 2011 to 2013 but in these trends the 2010 year stands out as an exception.
Based on data to summer 2013, it is difficult to ascertain if solar PV is contributing meaningfully to the situation hypothesised.
3) Possible further analysis
It is important to note that the analysis has been performed solely on the basis of AEMO’s Dispatch Demand Target for Queensland:
Dispatch Demand Target is AEMO’s forecast, set at the start of the Dispatch Interval, of where the actual (metered) demand will be at the end of the Dispatch Interval, 5 minutes later.
It was important that this analysis be performed with respect to this data point as this is the input AEMO uses in dispatching the market (hence setting the price).
Were the analysis above to show clearly (which it does not – at least to summer 2013) that increased solar PV produces significantly greater opportunity for generators to exercise transient market power, then two additional questions would need to be asked;
3a) Has Demand forecasting become more difficult because of solar PV?
Given the variable, embedded, and disaggregated nature of solar PV, it seems to make sense that this might be an increasing issue in the future, as the penetration of solar PV continues.
It may be that, addressing the difficulty in forecasting would reduce the number of instances where there is a large change (up, or down) in Dispatch Demand Target as a result of the dispatch process recovering from forecast error.
We have not performed any analysis that would show the extent to which this is actually an issue – if you know of something you can point our readers to, please leave as a comment below?
To the extent that this is the case, then the success of AEMO’s current efforts in developing a solar forecasting process (such as the ASEFS, and the Energy Conversion Model) are critically important to reducing “unnecessary” volatility.
3b) Or has metered “scheduled” demand actually become more volatile?
Alternatively, perhaps the actual metered demand has become more volatile on a Dispatch-Interval-by-Dispatch-Interval basis, in which case the clues picked up above in the analysis of Dispatch Demand Target are just reflective of the emerging physical reality?
If this is the case, then other approaches would be required to be implemented if it was desired* that levels of volatility were kept within historical levels.
* Note that we are not necessarily advocating that artificially reducing volatility by implementing further distortions of the spot market would automatically be the most economically efficient outcome.
Such approaches might include implementing storage solutions (to the extent that these are commercial).
3c) Both would probably apply, in some measures
As with most complex systems (the NEM always did qualify as one, and is becoming more complex) it’s likely that there are multiple issues intersecting – including the two above, and others as well.
Have we missed something significant in the above? If so, we’d certainly be interested in your thoughts – either as a public comment below, or offline in private.


Paul, it is refreshing to see someone such as your self question the myth that because renewables effectively bid in at zero that it always results in lower prices. If generators that are dispatchable are relying on pool and contract revenues rather than REC payments, then they will endeavour to “game” prices to maximise total revenues. I think it’s also important to note the effect of less gas contracting by peaking OCGT’s that will mean higher SRMC’s, shorter run times and consequently higher prices.