Coincident with our post recapping electricity demand across summer 2012-13 on Friday, the ESAA was tweeting about how Victoria has seen its highest electricity demand in 4 years on Tuesday 12th March.
Out of curiosity we had a look at a range of snapshots emailed to a general library email account we maintain within the company, to record market events as they occur. In particular we note two significant things on that day:
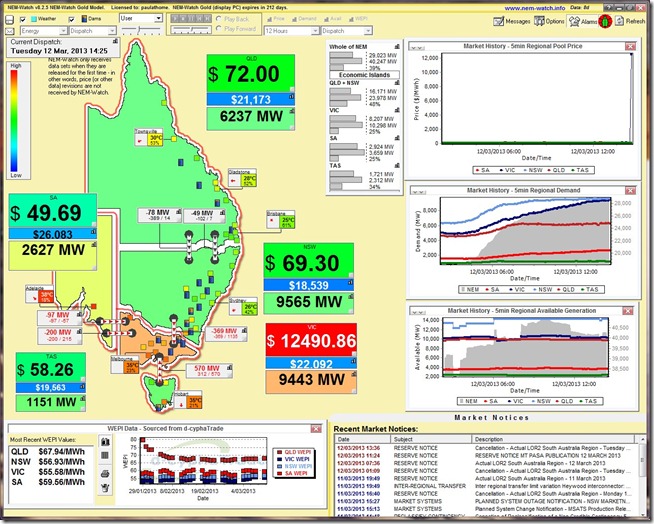
1) Approximately 400MW of DSR appears to operate in Victoria at 14:25
At 14:25 we see, in the snapshot saved from NEM-Watch at the time, that the VIC price spiked up near the Market Price Cap:
We can see the temperatures in VIC and SA were sizzling at the time.
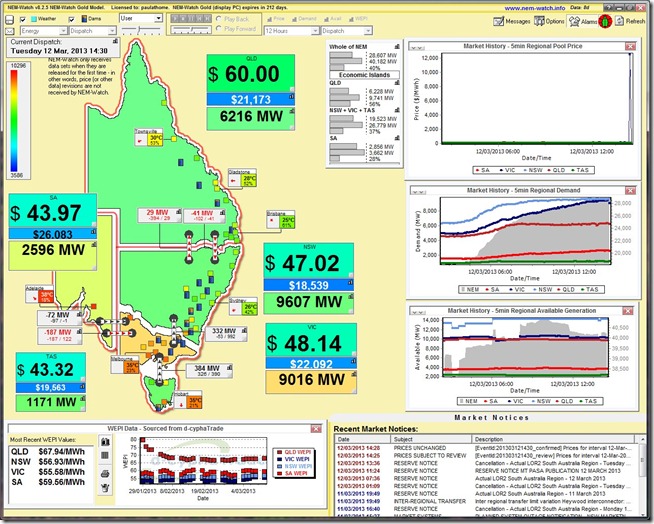
In response to this 5-minute spike in price, we see that the Victorian demand (on a dispatch target basis) dropped from 9443MW to 9016MW at 14:30 (i.e. by a very significant 427MW) – as shown in the attached snapshot:
As a result of this reduction in demand, the price subsides to more normal levels.
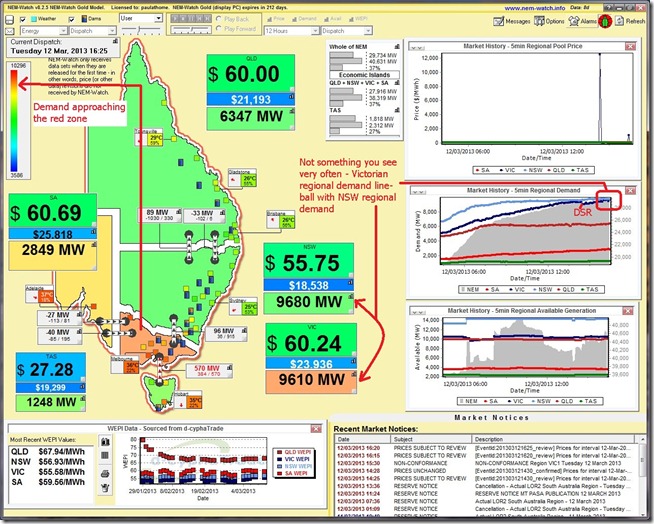
2) Demand peaks at 9,666MW at 16:15
We then see (in another NEM-Watch snapshot) that the demand recovered (as prices subsided) and then continued to grow to peak at 9,610MW at 16:25 (NEM time), shown in NEM-Watch on a dispatch target basis.
We saw, throughout the day, that demand levels were slightly elevated in South Australia by virtue of the temperatures there – but remained stuck in the boring green zone in NSW, QLD and TAS.
This meant that the NEM-wide demand did not even reach 30,000MW.
3) How does this compare to other demand levels in March?
Using NEM-Review we are can look at prior Victorian regional demands in March, and we see that the demand seen on this day was just shy of the record demand for March seen back on 17th March 2008, coincident with the heat wave that assaulted South Australia in that month.
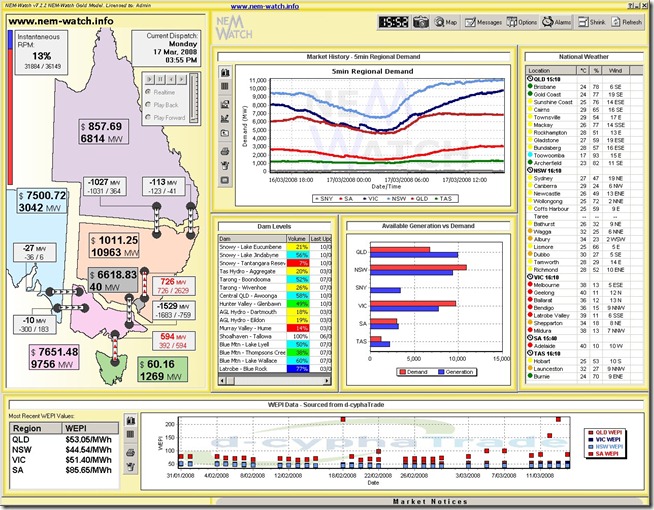
To provide some comparison, we have attached a snapshot taken from an earlier version of NEM-Watch from back at the time (15:55 on Monday 17th March 2008) to show how demand peaked higher (even 5 years ago) by about 150MW.
Of particular interest in this illustration is how the NEM-wide demand was shown to be 31,884MW at the time, compared to only 29,734MW last Tuesday – and (because of this lower NEM-wide demand, and also plenty more surplus capacity) the Instantaneous Reserve Plant Margin was much lower back in 2008.
As such, we can see how the price was high across all regions in 2008 – whereas the price only spiked in Victoria last week, and only temporarily.
It seems summer 2013 still has a bit of bite left yet – but even the hot weather is not having the same effect as was have been the case 5 years ago – due to these factors suppressing demand.


Be the first to comment on "Highest electricity demand for Victoria in four years last Tuesday (12th March) – and 400MW of DSR operates"