In recent weeks, there has been significant interest in the media about developments in the NEM following from (but not necessarily fully the result of) the introduction of the Carbon Tax from 1st July 2012.
Some of these developments have included the following:
1) The periodic closure of Alinta’s Northern Power Station in South Australia;
2) The closure of Delta’s Munmorah Power Station in NSW;
3) The closure of one unit at EnergyAustralia’s Yallourn Power Station in Victoria – running hot on the heels of the problems experienced in June and July with the flooding of the coal supplies;
4) The closure of one unit at Stanwell’s Tarong Power Station in QLD; and
5) Current technical problems at the Eraring Power Station in NSW leading to all four units being offline for a number of weeks.
Hence it was of interest that we opened NEM-Review v6 and ran some quick queries on four sample power stations – all coal-fired, and one from each of the mainland regions – in order to put these recent developments in some form of historical context.
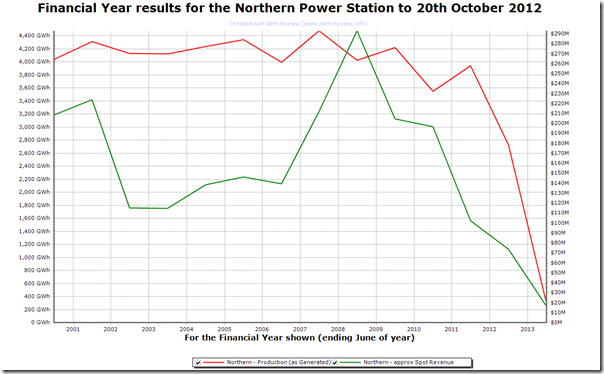
Starting with the Northern Power Station and heading north-east, we see that output began declining a number of years ago, and accelerated in 2011-12 in the lead-up to the closure decision.
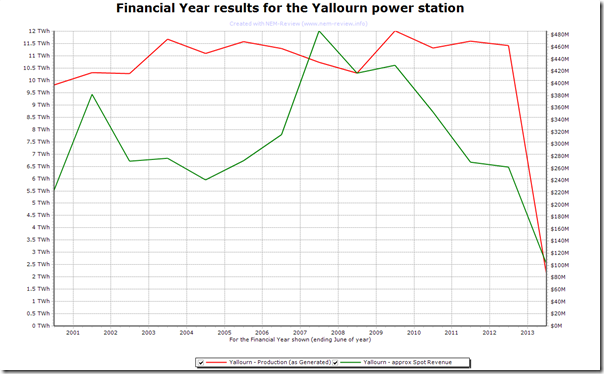
When completing a similar analysis for Yallourn Power Station we see a similar spike in prices through 2006-07 and 2007-08, due to the effects of the drought – but we do not see the same decline in production at Yallourn, because of the relative difference in regional short-run marginal cost (SRMC) order of the respective stations:
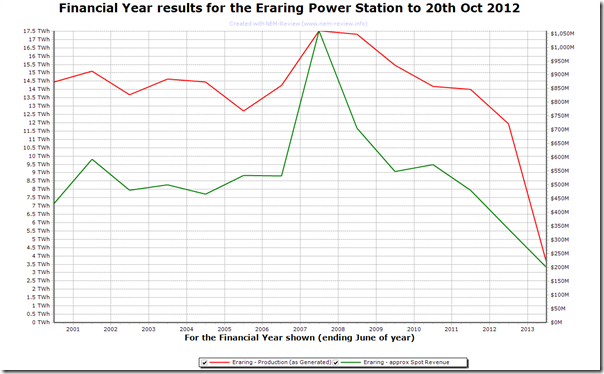
Moving to NSW, we see that Eraring Power Station has been varying to a greater degree than Yallourn (due to the higher SRMC) through the history of the NEM, but that (like for other stations) spot revenues have been fluctuating significantly:
We also see a more pronounced spike in spot revenues in the 2006-07 financial year than was apparent for Yallourn.
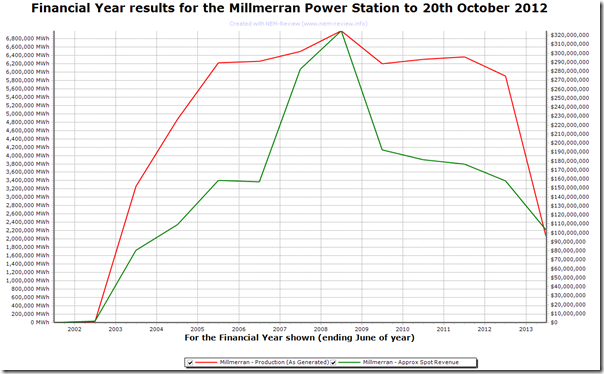
Finally, in QLD we look at the Millmerran Power Station and see that production volumes have been fairly stable since commissioning (with a spike in the drought year of 2007-08 to compensate for the reduced output at both the drought-affected Swanbank and Tarong power stations.
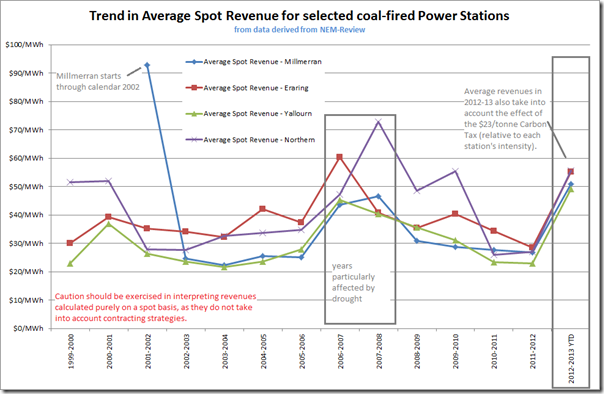
Combining the results for the four stations selected for this analysis, we’ve produced the following trend of average spot revenues by financial year for each station:
Two of the most remarkable long-term trends apparent in the charts above are that:
1) Average spot revenues are seen to hold relatively stable across the 14 years shown, for any of the four stations (in other words, adjusting from inflation, average spot revenues have been declining).
This underlying trend is separate from the particular spikes due to the drought, commissioning, and the carbon tax – and (in the earlier years) the lack of capacity in SA.
2) In addition, in many years the average spot revenues are seen to be lower than the generally reported figures for the Long-Run Marginal Cost (LRMC) of these stations:
With this in mind, it might be concluded that more recent changes in the market (declining demand, more significant growth in subsidised renewable generation, and the effect of the carbon tax) have just layered onto the already unattractive position these generators have found themselves in through many years of the NEM.
In this way, it might be seen that some kind of capacity withdrawal was probably on the cards even without these other three compounding factors.


Leave a comment