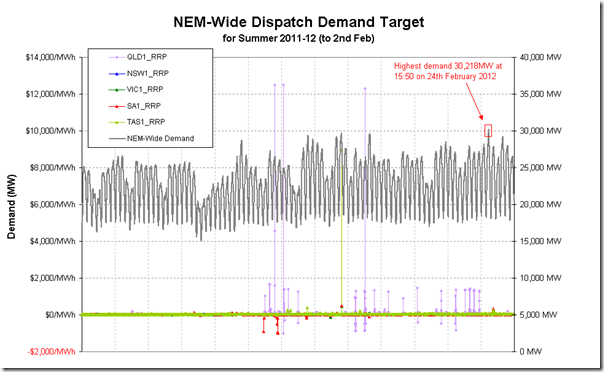
Well, “Summer” – or what masqueraded as it – has been and gone for 2011-12, and we’d like to recap on what happened over the summer period in this post:
As we can see from this chart, the NEM-wide demand (measured on a dispatch target basis – as shown in NEM-Watch and as used in our “Best Demand Forecaster” competition every summer) peeked* above 30,000MW only once during that summer – this was on Friday 24th February, as noted here.
* please pardon the pun
For the second summer season running that’s been heavily influenced by La Nina, it’s understandable that demand was low – and certainly these other types of factors would also have all contributed, to varying degrees.
The lower demand is probably the main reason for prices being extremely flat across the summer period:
1) We see in the chart above only three occasions when prices spiked to (at or near) the Market Price Cap in Queensland:
– at 14:00 on 10th January,
– at 9:35 on 12th January, and
– at 14:30 on 29th January.
even these spikes did not stop the time-weighted average price closing below $30/MWh (and the other mainland regions suffered an even more extreme fate).2) We see only one occasion when the Tasmanian price spiked significantly (at 15:25 on 24th January) – but, due to a higher median price over summer, we saw the average finish above $34/MWh.
3) The other three regions were becalmed, with not a single dispatch interval above $500/MWh.
4) As a final point of interest, we do see in the chart above a significant number of instances where the dispatch price in QLD spiked above $1000/MWh (30 intervals, in total) – often as a result of the 855-871 constraint noted here.
As a result of the flat (and low median) prices:
1) We’ve heard of energy users on spot price exposure (some clients of ours using deSide to facilitate their demand side response) not even needing to curtail over summer to be significantly ahead of the retail prices they had been offered previously;
2) We’ve seen a number of financial traders leave the market, or scale back operations – at least in part because of the flat prices.
3) We’ve heard a range of stories about the ways in which the physical participants have fared, depending on contract positions and trading strategies, etc…
4) We’ve also seen various segments of the market keen to claim credit for the lower wholesale costs; and
5) We also continue to see confusion/consternation about the mis-match between high retail prices and low wholesale price – which seems to be caused (at least in part), due to a time lag between the two notional commodities.
However, it’s also important to note that demand did present some outcomes, on a regional basis:
1) In Queensland, we saw the demand peak at 8,757MW on 9th January (here’s a view of 2 days later, with regional demand still high).
2) In South Australia, we saw demand climb to 2,955MW on 23rd February, somewhat below the all-time record (here’s a view the following day, with temperatures still high, but demand lower).
3) However the highest we saw in NSW was only 11,942MW on 30th January (1000MW’s below the all-time record).
4) Similarly, Victorian demand reached only 9,110MW on 24th January at 16:00 (which was coincidentally noted in this post as the point of the highest NEM-wide demand, until pipped on the 24th February).
5) Tasmania also reached only 1,349MW – much earlier in summer, on 5th December.
We’ll be curious to see what happens as the coming year unfolds, if La Nina is on the way out…


Leave a comment