Leaving the office in the capable hands of a reduced team for a few weeks over the summer break, I returned to find that our semi-regular competition had taken an interesting turn, this year …
This year, at the initiative of others in the team, we undertook to publish the names and individual entries of each of the entrants (except if they objected, which no-one did).
As you might know, we strive to promote “Openness” as one of the core values of our company:
1) Through our software, we strive to make the market understandable to a wide range of people – as one facet of working to ensure the market delivers sustainable benefits;
2) Within our company, we share information openly about where we are headed, and how we’re going to get there;
3) Through our Agile development processes, we adopt an open dialogue with our clients as we seek to (collaboratively) make our products better and better, every month and year.Hence you’d understand that I don’t mind this approach at all – and, it seems, nor do a number of people who entered the competition again this year – though I do wonder if we scared anyone off (let me know if it did)?
So we wonder what we else we can learn given that the identity of the bidders has been revealed?
List of entries (sorted)
For completeness, I’ve moved the record that we’d temporarily placed on another site to here – this has also been sorted in ascending order of demand estimate, in order that you can easily keep tabs on who’s in the running for the BBQ this year:
Forecaster # entries Date Organisation Forecast Bid (MW) Aden Fanning 6 30/12/2011 InterGen 31,003 Aden Fanning 6 29/12/2011 InterGen 32,003 Alan Lao 1 23/12/2011 Delta Electricity 32,326 David Sweeney 1 23/12/2011 Aurora Energy 32,400 Connell Burke 1 31/12/2011 Westpac 32,750 Chris Muffett 1 28/12/2011 AEMO 32,911 Aden Fanning 6 28/12/2011 InterGen 33,003 Bandu Gamage 1 23/12/2011 AEMO – Melbourne 33,025 Mark Roberts 1 23/12/2011 Attunga Capital 33,333 GaryWyatt 1 23/12/2011 ANZ 33,351 Alistair 1 23/12/2011 ANZ 33,500 Ben Blake 2 30/12/2011 AEMO 33,501 Jorge Heijo 1 23/12/2011 ANZ 33,617 Reinhard Struve
(see note below)9 29/12/2011 in Adelaide 33,619 Ian Phillips 3 29/12/2011 InterGen 33,897 Brian Massey 8 29/12/2011 in Adelaide 33,999 Aden Fanning 6 26/12/2011 InterGen 34,003 Mottel Gestetner 1 27/12/2011 EnerNOC 34,008 Ian Philips 3 28/12/2011 InterGen 34,183 Reinhard Struve 9 30/12/2011 in Adelaide 34,184 Reinhard Struve 9 28/12/2011 in Adelaide 34,435 Paul Daniel 1 23/12/2011 ANZ 34,441 Steven Grotte 1 23/12/2011 ANZ 34,450 Ben Blake 2 29/12/2011 AEMO 34,501 Kathy Staggs 2 29/12/2011 NSW Trade and Investment 34,555 Elijah Pack 2 29/12/2011 AEMO 34,566 Tim Astley 1 23/12/2011 Office of Energy Planning and Conservation – Tasmania State Government 34,567 Elijah Pack 2 23/12/2011 AEMO 34,568 Brian Massey 8 28/12/2011 in Adelaide 34,579 Richard Hickling 1 30/12/2011 AEMO 34,636 Simon Taylor 1 28/12/2011 Powerlink 34,672 Brian Massey 8 30/12/2011 in Adelaide 34,673 Brian Massey 8 27/12/2011 in Adelaide 34,895 Aden Fanning 6 23/12/2011 InterGen 35,003 Brian Massey 8 23/12/2011 in Adelaide 35,017 Ben Johnson 1 30/12/2011 ERM Power 35,105 Ian Philips 3 23/12/2011 InterGen Australia 35,200 Reinhard Struve 9 31/12/2011 in Adelaide 35,327 Ben Hayden 1 23/12/2011 NRG Gladstone Operating Services 35,328 Brian Massey 8 24/12/2011 in Adelaide 35,335 Chris Scott 4 30/12/2011 Powerlink Queensland 35,351 Kathy Staggs 2 23/12/2011 NSW Trade and Investment 35,444 Brian Massey 8 25/12/2011 in Adelaide 35,645 Brian Massey 8 26/12/2011 in Adelaide 35,895 Reinhard Struve 9 27/12/2011 in Adelaide 36,145 Chris Scott 4 29/12/2011 PowerLink Queensland 36,251 Chris Scott 4 28/12/2011 Powerlink 37,250 Reinhard Struve 9 26/12/2011 in Adelaide 37,895 Chris Scott 4 31/12/2011 Powerlink Queensland 38,001 Reinhard Struve 9 25/12/2011 in Adelaide 38,145 Reinhard Struve 9 23/12/2011 in Adelaide 38,515 Reinhard Struve 9 24/12/2011 in Adelaide 38,645 Aden Fanning 6 31/12/2011 InterGen 38,700 Anon 1 23/12/2011 Anon 3,351,329 Out of interest, I’ve also included a column to make it clear how many entries each person made over the days allotted.
Special note should go to Reinhard Struve from Adelaide, who placed an entry every single day the competition was open – that’s some commitment (and a real need for a BBQ)!
Analysis of entries
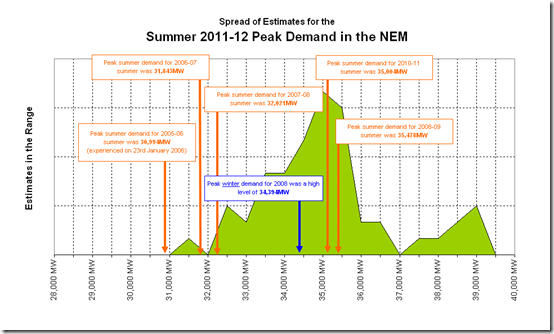
As we’ve done in previous years, we’ve done some analysis to see what it tells us of where a collective view is of where peak* demand will end up (note we have excluded the extreme bid, as this is most likely the result of trouble making entries with small keys on smart phones!)
As can be seen here, the consensus view seems to be that it will be a hot summer with demand peaking at around the level it achieved in previous hot summers, but not much higher (there are a few entries out to the right of this point, but they seem to be more defensive strategies from people trying to win the BBQ).
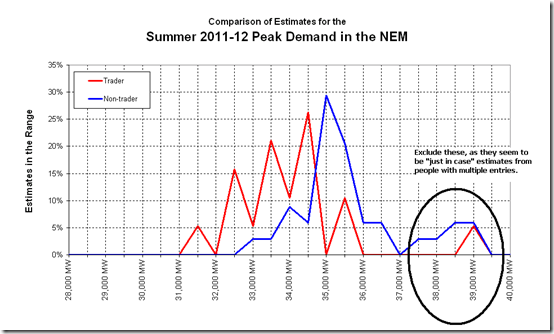
How do traders and non-traders compare in their views? On the whole, it does appear that the traders are slightly more conservative in their estimates, whilst the non-traders are more bullish.
* Note that this competition is all about where the peak demand will land (even if only for a single dispatch interval through the summer period) – average demand is another matter entirely, as discussed here.
Interest in Electricity Demand
We saw last week Marcus Priest make a few comments in the AFR on Thursday 5th January about how the hot weather in NSW and VIC drove demand higher last week, despite the fact that many were not back at work.
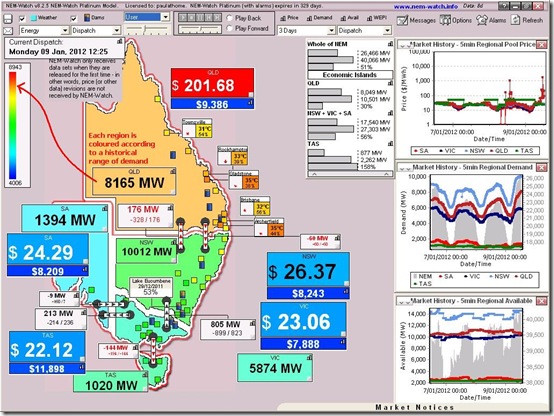
Today it’s predicted to be a scorcher for the southern part of QLD – already temperatures and demand are rocketing up, as seen through this screenshot from NEM-Watch v8:
Let summer roll on, in order that we can see who’s closest to the mark…. (and stay tuned here for more updates)


Hi Paul,
thanks for providing a bit of fun and entertainment over the Christmas break, and you’re right: I really do need that barbeque!
But you are wrong in saying that I only submitted 9 guesses. In accordance with your Terms and Competitions, I provided a guess for every single day until 2 January 2012. But your analysis only includes guesses until 31 Dec 2011.
You wouldn’t want to deny us of those valuable last two guesses on 1 and 2 January now, would you?
Hahaha, gotta love people who work in the energy compliance area and read the fine print…
Cheers
Reinhard
Hi Reinhard
Thanks for picking this one up (and please accept my apologies for the goof).
I have updated the listing, and the analysis on this new posting made today.
Like many, I will be very curious to see where peak demand lands this summer (and I don’t even stand to gain a BBQ!)
Regards
Paul
An excellent chance to test the theory of http://en.wikipedia.org/wiki/The_Wisdom_of_Crowds
Maybe we should take the average of those with multiple entries and then the average of each individual’s pick and see if the “crowd” is indeed wise?
Tim
Hi Tim
Thanks for the comment.
It is an intriguing book – it’s one of the ones in our office library that has been read and reviewed by others in the company (and I appreciated the Wikipedia reference).
In updating the results table to correct my omissions, I also included another chart at the bottom designed to draw out, as much as possible, the Wisdom of the Crowds in this instance.
Interested in your thoughts?
Paul
Tim,
I would certainly be curious to see the result of such an analysis. If you find the time to do so, let us know the outcomes.
Cheers
Reinhard