Much the same as has been already reported for Monday and Tuesday this week, extreme temperatures in parts of the NEM drove demand higher (and with it spot prices).
A few additional points to note today:
1) Instantaneous Reserve Plant Margin drops
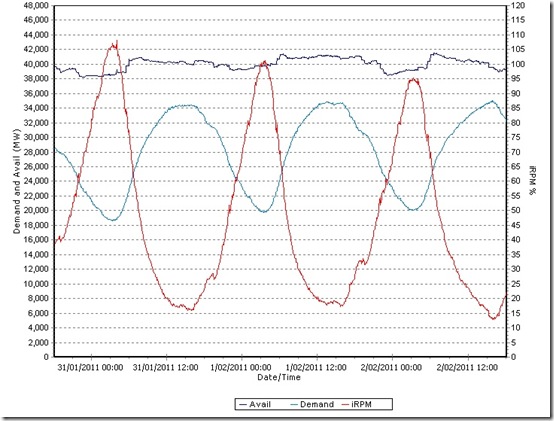
This measure is a non price-based indicator of the balance of supply/demand balance across the NEM. As shown in the chart below (taken from NEM-Watch), the IRPM dropped to a low of 12.96% at 15:50 NEM time.
This was lower than we had seen it on either Monday or Tuesday.
To put this into some context, see this article about the extremely low levels of IRPM experienced in winter 2007. As shown, the supply/demand balance was tight, but not as tight as it has been at rare times in the past.
2) Demand continues to climb
In the chart above, we can see that the demand peak was more pronounced than it was on either of Monday or Tuesday this week.
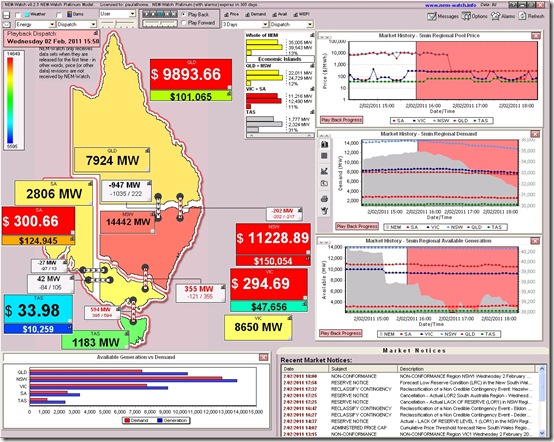
It was also slightly higher – crossing the 35GW threshold to be 35,004MW at 15:50 today (coincident with the dip in IRPM). See how this appeared (playback in NEM-Watch) across the market:
As would be expected with a tight supply/demand balance, the prices are elevated across the mainland (not in TAS, which had a relatively high surplus of capacity).
3) Cumulative Prices
In the snapshot above, we can see the Cumulative Price (safety valve for the market) in NSW has risen above $150,000/MWh.
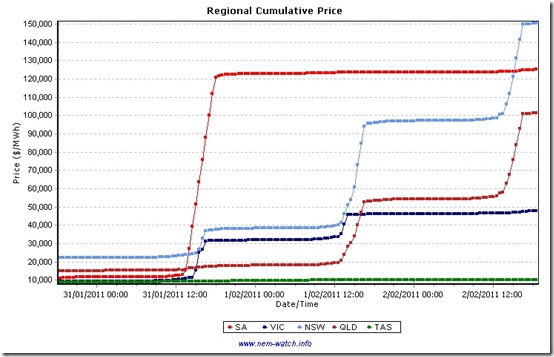
In this chart (also taken from NEM-Watch) we see how the Cumulative Price for each of the regions has trended over the past 3 days.
4) What else is to come…
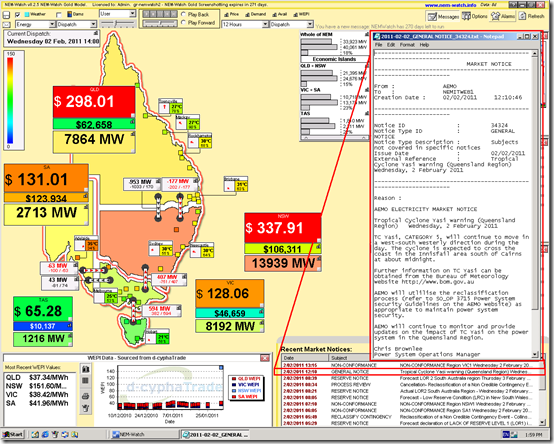
We also noted this Market Notice issued by AEMO, alluding to some of the risks posed to the NEM by the approach of Tropical Cyclone Yasi:
Stay tuned for more…


Leave a comment