
0) Prologue
Yes, our blog articles are becoming long enough that we even need to include a prologue!
In the process of putting this article together, we had a great laugh on April Fool’s Day when reading this “news release” informing us that Al Gore had recanted of his great global warming conspiracy.
Note here that it may not have been the original press release, but it was certainly the first one we found.
What amazed us even more, in the aftermath, was how this joke circulated through “blogdom” very quickly, to the point whereby it was being quoted as the gospel truth – and even appeared on some prominent news sites (as truth).
This example does tend to illustrate how easily it is for misinformation (whether innocent misunderstandings or deliberate lies) to be circulated and to become accepted as truth, especially in the internet age. This is an issue on both sides of the climate change debate, along with a wide range of other areas.
1) Background
“Earth Hour” was a concept developed by the WWF to promote awareness of the risks of climate change.
It first ran just in Sydney in 2007, and generated considerable interest, on both sides of the fence – with both climate change sceptics and climate change believers becoming very vocal about the value (or otherwise) of such an event.
Further information about Earth Hour is provided by the WWF on the dedicated website:
http://www.earthhour.org/
Here’s the description of Earth Hour on Wikipedia – and there are hundreds of other references (most of which we have not reviewed).
Since that initial event, Earth Hour has been held at the same time on two successive years, with an increasing number of locations around the world participating – and still continues to galvanise commentary by supporters and detractors alike.
Following the conclusion of Earth Hour 2009, out of interest we thought we’d have a closer look at what happened in Australia’s National Electricity Market over the period, leading to the preparation of these three articles:
- Earth Hour in the NEM 2007
- Earth Hour in the NEM 2008
- Earth Hour in the NEM 2009 (this article)
Disclaimer –
Please note that we’re not PhD-powered analysts/consultants in the energy market, nor are we climate change scientists (or sceptics).
We’re just a bunch of geeks who spend some time watching the electricity market with the software we’ve created. In the process of doing so, we make some observations, some of which we publish online here.
As such, we’re neutral about the usefulness of Earth Hour, as a concept – and about the climate change, in general. We’re the first to admit that we don’t have the background and training to even begin to add constructively to whether anthropogenic global warming (AGW) is happening, or not.
We are just aiming to maintain our software such that it continues to be useful in helping people to understand the electricity market – whatever form of carbon pricing it includes in future.
Plus we’re just curious…
We’ve published this information here as you may be interested, not because we believe it is definitive on the topic. Indeed, we fully accept that we may have overlooked a number of things (possibly big ones).
2) Contents
0) Prologue
1) Background
2) Contents
3) Reported results
(a) Reported Electricity Reduction
(b) Other General Statistics
(c) Miscellaneous Media Reports
(d) Photos of Brisbane
4) Criticisms
(a) Amount of Electricity Reduction
(b) Reduction in Greenhouse Gases?
i. Marginal Generators
ii. Candles
iii. Cars, Helicopters, etc…
(c) Comparison with the Blackout
(d) Is it providing the wrong Symbol?
(e) Sustained Reductions not occurring
(f) Competition with the GFC
5) Some data about Earth Hour
(a) NEM-Review Data for 2009
i. Queensland
ii. NSW
iii. The VIC Region
iv. The TAS Region
v. The SA Region
vi. NEM-Wide Effects
(b) Change in Response 2007®2009
(c) Playback in NEM-Watch
6) A few thoughts in conclusion
(a) A success in Raising Awareness
(b) Beyond the Symbolism
i. Lower reductions away from CBD
ii. 10% reduction not improved upon
iii. 5% Annual Reduction target dropped
iv. Converting Attitude to Action
(c) Hence, what’s next?
i. For Sydney
ii. Elsewhere
iii. Earth Hour Website
3) Reported results
Earth Hour in 2008 was organised between 8:30pm and 9:30pm on Saturday March 28th 2009.
Note that as daylight savings in NSW ended on 5th April 2009, this means that 20:30 NSW time equated to 19:30 NEM time.
As noted with respect to 2008, the Earth Hour organisers realigned the timing of earth hour to its original time (in Sydney) in 2007 – 19:30 Eastern Standard Time (NEM time).
Whilst, in theory, this should not have made much difference to the amount of electricity demand curtailed (as a 60W globe consumes the same amount of energy, regardless of whether it runs when the sun is up or down), it would have ensured the “before” and “after” camera shots were more striking.
(a) Reported Electricity Reduction
The following table provides some quoted statistics for the reduction in electricity usage in various parts of the National Electricity Market:
| Across the NEM | We had a quick look, but could not find any reports of NEM-wide reduction in consumption this year. |
| Sydney | According to the SMH, energy use dropped by 9% in the Sydney CBD. |
| Melbourne | According to the SMH, energy use dropped by 2% in the Melbourne CBD. We wonder why this was low, by comparison with other cities – perhaps the Australia Grand Prix was partly responsible?
This article in the Age notes that the total reduction across the state was actually a little higher (3%). |
| Canberra | According to ActewAGL (the retailer for the Canberra area) there was a 9.30 per cent drop in Canberra’s electricity usage exhibited during Earth Hour. |
| Brisbane | According to the SMH, energy use dropped by 7.6% across South-East Queensland (quoting Energex, the distributor).
Further details about the Energex numbers (including a breakdown by location) was provided on the Energex website. |
| Adelaide | We could not find (in our quick look) reported results for Adelaide, or South Australia. |
| Hobart | According to an article in the print edition of The Examiner “Tasmanians see the light with Earth Hour power reduction” a spokesperson for Aurora Energy was quoted as reporting a 6.7% reduction across Tasmania. |
| Perth | Western Australia is not a part of the “National Electricity Market” – however we did still have a quick look for reported reduction numbers in Perth, or the South-West. We could not find any. |
(b) Other General Statistics
Other (more general) reported results of Earth Hour 2009 were as follows:
- Earth Hour expanded further around the world:
- In 2009, a total of 88 countries participated (up from about 35 in 2008, we think);
- A total of 3929 cities participated (up from 370 in 2008) – including some of the most populated this year, unlike was reported to be the case in 2008;
- In the Australian context:
- According to this report at the SMH, 308 municipalities around Australia registered their participation.
- The organisers reported that 99 of the ASX100 companies registered their participation.
- Surveyed personal participation rates were broadly similar to the case for Earth Hour 2008 (again, highest in Canberra and lowest in Perth).
(c) Miscellaneous Media Reports
Media reports about Earth Hour included the following:
- The Sydney Morning Herald reported Earth Hour 2009 to be a success.
- The Courier Mail reported the results of Earth Hour 2009, beginning in Sydney and spanning the globe – but with (surprisingly) no reference to what happened in hometown Brisbane.
- In Melbourne, the Age reported some dissenters to the Earth Hour 2009 message.
(d) Photos of Brisbane
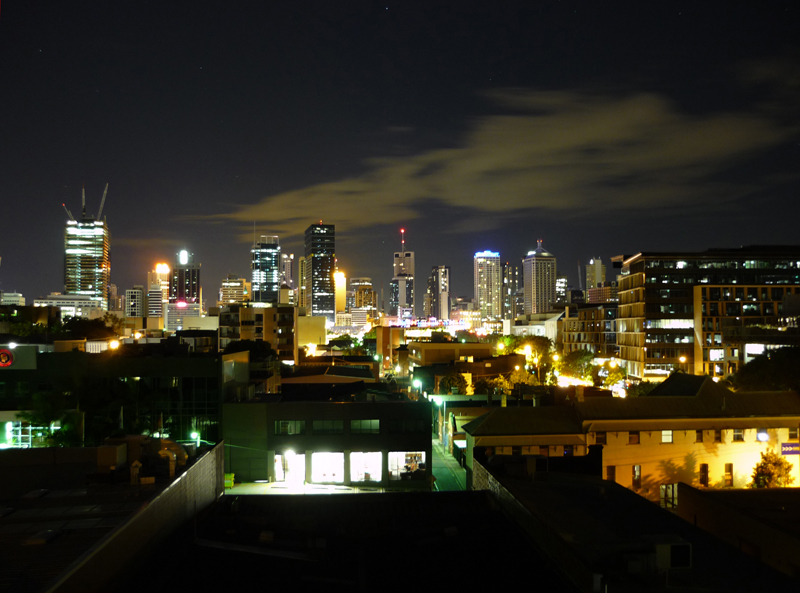
One of our software developers (Stephen Hurn), and budding amateur photographer, has provided us these two snaps taken from a similar position overlooking the Brisbane CBD.
The table outlines
| The Night Before
|
This photo was taken around 01:20am on Saturday morning.
This photo was taken with a 15 second exposure (hence this will have made the photo appear somewhat brighter as a result). |
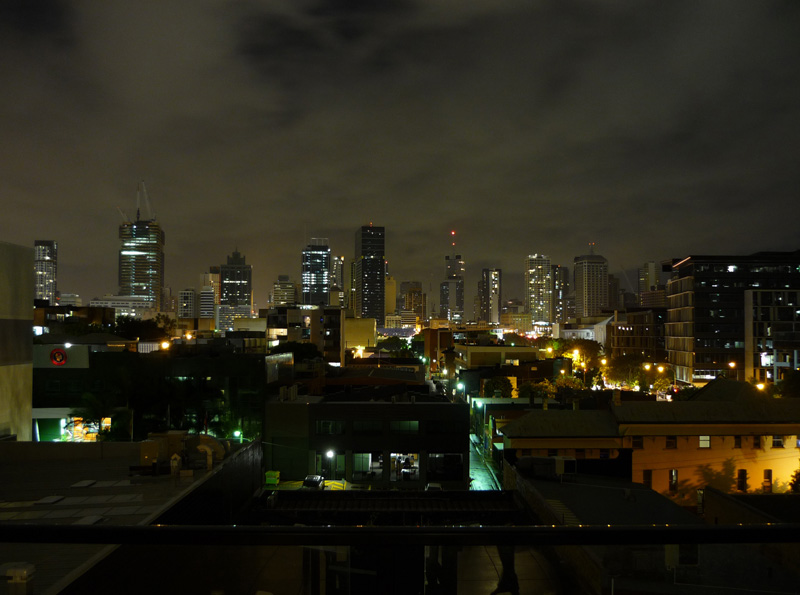
| During Earth Hour
|
This photo was taken at 20:55 (i.e. during Earth Hour) – hence.
We can clearly see a number of lights turned off in this shot. This photo was taken with a 5 second exposure, due to the differences in overhead cloud-cover and moonlight. |
4) Criticisms
(a) Amount of Electricity Reduction
Unlike the case in previous years, we did not find as much debate about the level of reduction in electricity demand. Nor (as noted above) was there as much open reporting of such measures.
(b) Reduction in Greenhouse Gases?
Instead, in the lead-up to (and following from) Earth Hour 2009, it seems that the wider population has become aware of more nuanced issues relating to the extent to which greenhouse gases emissions were actually reduced.
Yes, there were some informed people who were making these points back in 2007, or beforehand – however it does seem that the general public has gradually become aware of these issues.
i. Marginal Generators
One criticism which we noted in several locations, such as this post by Andrew Bolt, was that the amount of reduction in electricity demand had a smaller impact on reducing emissions than might have been hoped for – based on the assumption that the plants scaled back in output to keep pace with the drop in demand are the less greenhouse intensive plant.
For instance, Andrew notes that (during Earth Hour 2008):
Faced with less demand, NEMMCO, which picks which generators to use, wound down the most expensive first—Snowy Hydro, the Pelican Point gas turbines and a black-coal generator in NSW, all of which produce “cleaner” power than the cheap brown-coal stations of Victoria, which chugged on.
We believe that Andrew was referencing this report in The Age at the conclusion of the event the previous year (as we can find no reference in the News Media network).
Note with respect to that article that the reduction reported by AGL Energy would seem to be with respect to just Victoria, not the whole of the NEM, which Andrew had inferred.
Hence, we thought it would be of interest to include the attached chart, (generated with NEM-Review) highlighting a preliminary view of which generators reduced their output over the Earth Hour period in 2009:
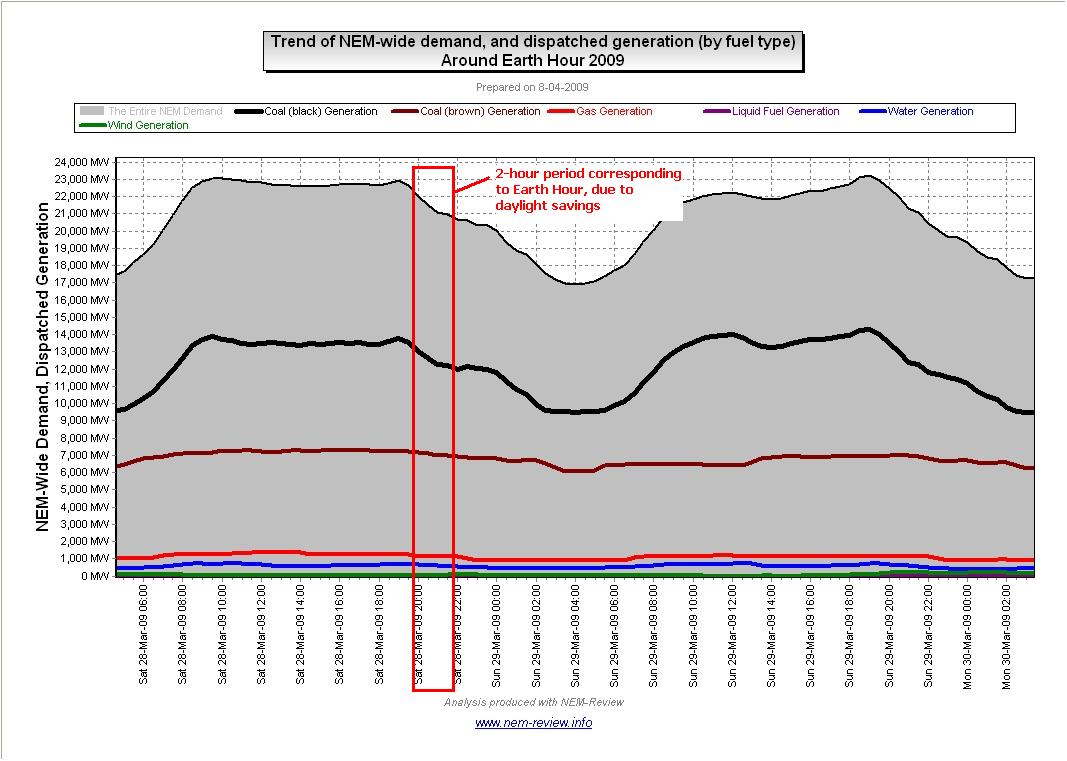
In the chart, we have aggregated total production targets (MW in each half-hour trading period) for each of the fuel types used in the NEM. A few things can be seen in this chart:
- For those who have not seen such a chart before, this reinforces the degree to which the NEM is based on coal-fired production, with:
- Black coal stations in QLD and NSW; and
- Brown coal stations in VIC and SA.
- In the period of Earth Hour, we see a significant reduction in output in the black coal stations is shown, whilst smaller reductions are registered in brown coal stations, and with gas turbines and hydro:
- Keep in mind that the majority is the result of the normal drop in demand that occurs around this time of day, every day – the Earth Hour effect (discussed below) just adds a little to the reduction;
- We’ve also included this data in the following table,
|
Approx intensity factor(1) |
Target at 19:30 |
Target at 21:30 |
MW reduction |
% reduction |
|
| Black coal |
1.0t/MWh |
13,545MW |
12,239MW |
1,306MW |
10% |
| Brown coal |
1.4t/MWh |
7,212MW |
6,977MW |
235MW |
3% |
| Gas |
0.6t/MWh |
1,242MW |
1,136MW |
106MW |
9% |
| Hydro |
0t/MWh |
678MW |
574MW |
104MW |
15% |
| Wind(2) |
0t/MWh |
25MW |
79MW |
54MW increase |
216% increase |
Please note with respect to the table above:
- Note that the “approx intensity factors” noted above are equivalent to quoted figures for the least efficient of that type of plant (hence the plant that would typically be curtailed first in the group).
- The numbers for dispatched wind totals have been included for interest only. Many of the smaller wind farms operating in the NEM are classed as “Non-Scheduled” and hence run whenever they want, and are not counted in these figures.
- As can be seen, the largest reduction over the 2-hour period was contributed by reduction in black coal production, with the 2nd highest (absolute) reduction being in brown coal stations. Hence, it is reasonable to conclude that the emissions reductions attributable to Earth Hour reductions over that period would have been approximately of the same relativity.
At its core, however, Andrew does highlight one of the core reasons why some price on carbon would be essential if significant change was to be made to the output of the brown coal stations (which have relatively high capital cost, but close to zero marginal cost currently).
ii. Candles
Separately, we noted an increased number of people promoting awareness of the irrationality of people turning off their lights, but then powering up on candles to the extent that the real emission reduction is negated (or even reversed).
The Christian Science Monitor is one of the sources of this commentary – it was also reported in the Australian.
We have not bothered to check the accuracy of these calculations.
iii. Cars, Helicopters, etc…
As with previous years, there were a number of blog posts talking about the irresponsibility (or just naivety) of people (and media companies) who generated more emissions than they saved by travelling to take in the spectacle.
(c) Comparison with the Blackout
Coincidentally, only 2 days after Earth Hour (Monday 30th March), Sydneysiders were forced to contend with a blackout of a significant area of the CBD due to a transmission cable fault.
This was reported in a variety of media, including:
- News Daily;
- In the News Corp media;
Not to pass up an opportunity, Andrew Bolt proceeded to use the incident to highlight the (in his view) futility of the Earth Hour effort.
This comment was responded to, in kind, by some commentary in Crikey.
(d) Is it providing the wrong Symbol?
At a more fundamental level, Keith Lockitch at the Ayn Rand Institute argued that even the choice of asking to forgo lighting for an hour is sending the wrong signal (symbolically).
In particular, the article notes:
This blindness to the vital importance of energy is precisely what Earth Hour exploits. It sends the comforting-but-false message: Cutting off fossil fuels would be easy and even fun!
This argument has been repeated in many different media, but none (that we have seen) as succinctly as this one.
If the Earth Hour phenomenon is to achieve any sustained benefit, then this issue is clearly one that will need to be addressed in future events.
Whilst Keith agues that:
Earth Hour symbolizes the renunciation of industrial civilization.
However an alternative view might be that it clearly illustrates the mammoth challenge (perhaps impossible) that greenhouse gas reductions must be achieved whilst still providing for an increasing per-person GDP locally, and across the world.
To do this, it looks likely that both will have to be achieved:
- Greenhouse gas emissions will need to be decoupled from GDP; and
- As a precursor to this (at least to some degree), GDP will need to be decoupled from total energy consumption.
A “diabolical challenge”, to quote Professor Garnaut.
(e) Sustained Reductions not occurring
In our previous article, we noted that Matthew Warren (in his previous guise as a News Corp journalist) noted that the take-up of green energy was not as extensive as professed participation rates during Earth Hour 2009 would have implied.
In the lead-up to Earth Hour 2009, Matthew (now in his new role as CEO of the Clean Energy Council) is quoted to follow the release of an ABS report that highlighted how Australia’s per-capita energy consumption had soared more than 50% over 20 years.
Matthew is quoted as noting:
Clean Energy Council chief executive Matthew Warren said the ABS snapshot predictably demonstrated modern households consume more energy because it was convenient.
“The reality is that the increased energy use is a function of people being financially rich, choice rich, but time poor. We’re using energy to make our lives easier, but we have to think more about how we can be more effective in our energy use.”
(f) Competition with the GFC
Prior to (and post) Earth Hour 2009, criticisms seemed to be more vocal than in previous years – including this report in the News Corp media which highlighted how economic concerns had risen in 2009 (at the expense of the public’s concern about the environment).
Whilst this change in focus would be due, at least in part, to the global financial crisis (GFC) it may be that the public have become much more aware of the “truly diabolical” nature of the climate change issue (to quote Professor Garnaut), in which the “easy” options are not going to deliver changes in greenhouse gas emission levels anywhere near the level we are told are needed to avert the worst impacts of climate change.
5) Some data about Earth Hour
(a) NEM-Review Data for 2009
In our report for Earth Hour 2008, we included some numbers from our NEM-Review software to clarify how the load shape on the evening of Earth Hour was different from that on other Saturdays.
i. Queensland
Starting in the north, the following chart highlights how the QLD region demand trended over time during 28th March (“Earth Hour” day) compared with preceding and subsequent Saturdays.
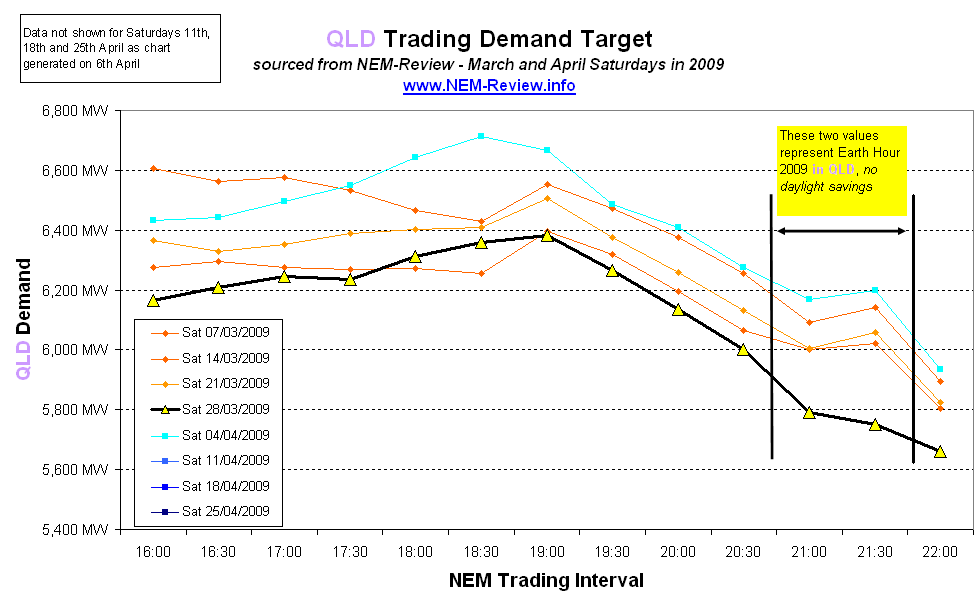
From this you can form your own view about the scale of the reduction.
You might like to compare this with the equivalent chart for Earth Hour 2008 in QLD.
ii. NSW
Below is a similar chart for NSW during Earth Hour 2009
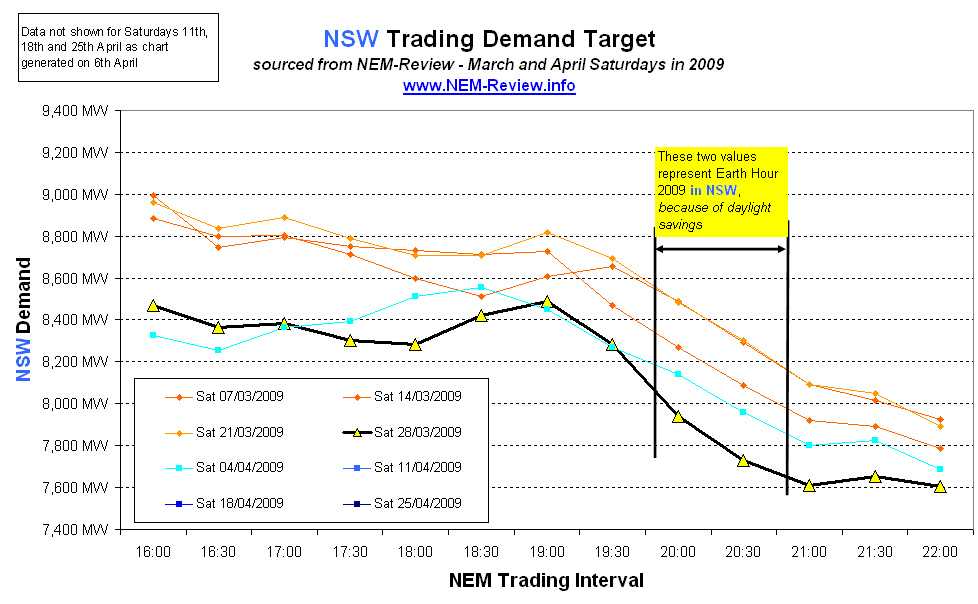
Likewise, you can compare against these charts for Earth Hour 2008 in NSW, and (being the only city that took part) Earth Hour 2007 in NSW.
iii. The VIC Region
Moving further south, we include the similar chart for VIC during Earth Hour 2009.
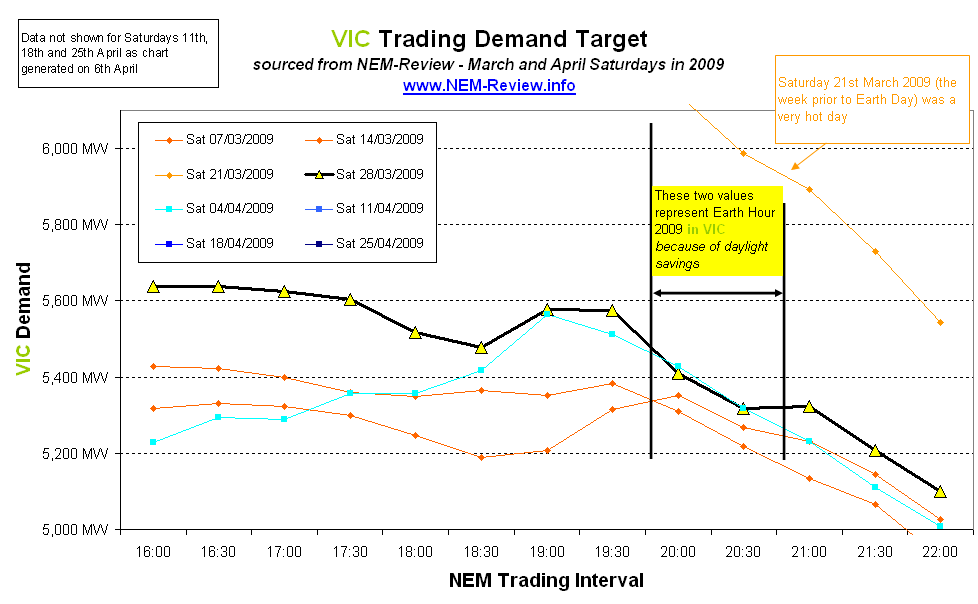
Likewise, you can compare against this chart for Earth Hour 2008 in VIC.
iv. The TAS Region
Furthest south, we include the similar chart for TAS during Earth Hour 2009.
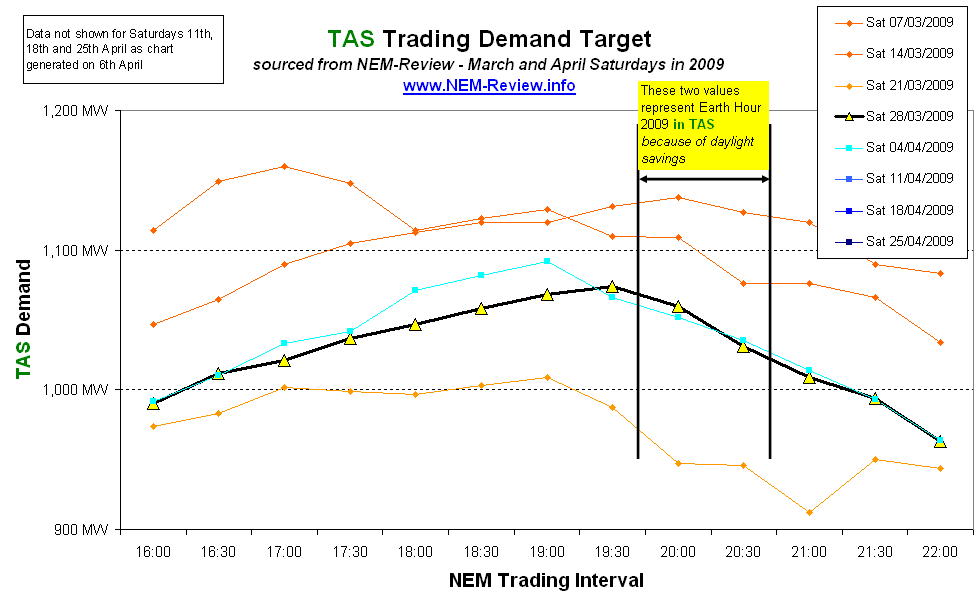
Likewise, you can compare against this chart for Earth Hour 2008 in TAS .
v. The SA Region
We conclude with the following chart for South Australia.
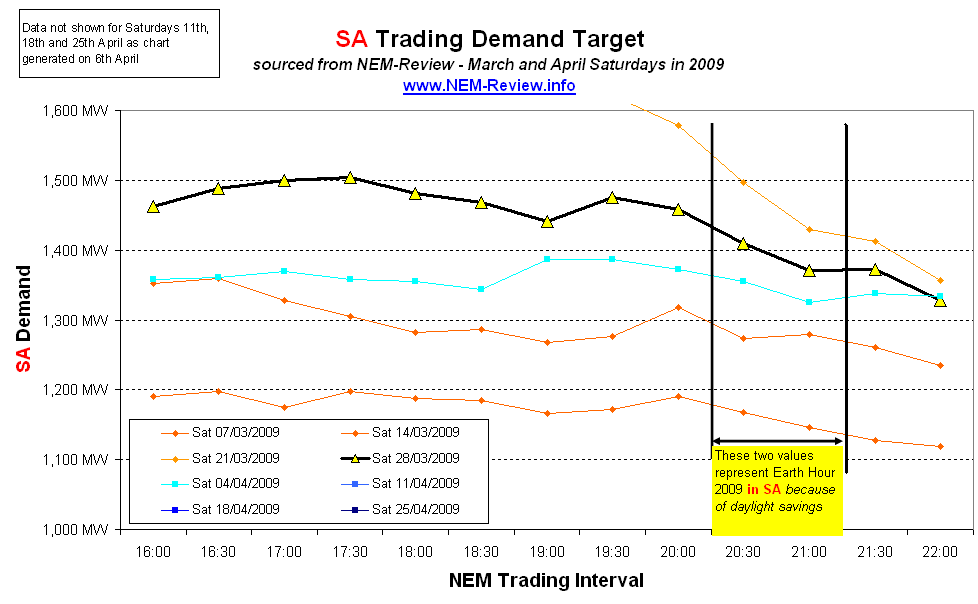
Likewise, you can compare against this chart for Earth Hour 2008 in SA .
vi. NEM-Wide Effects
To summarise, we have included the following chart for the whole NEM:
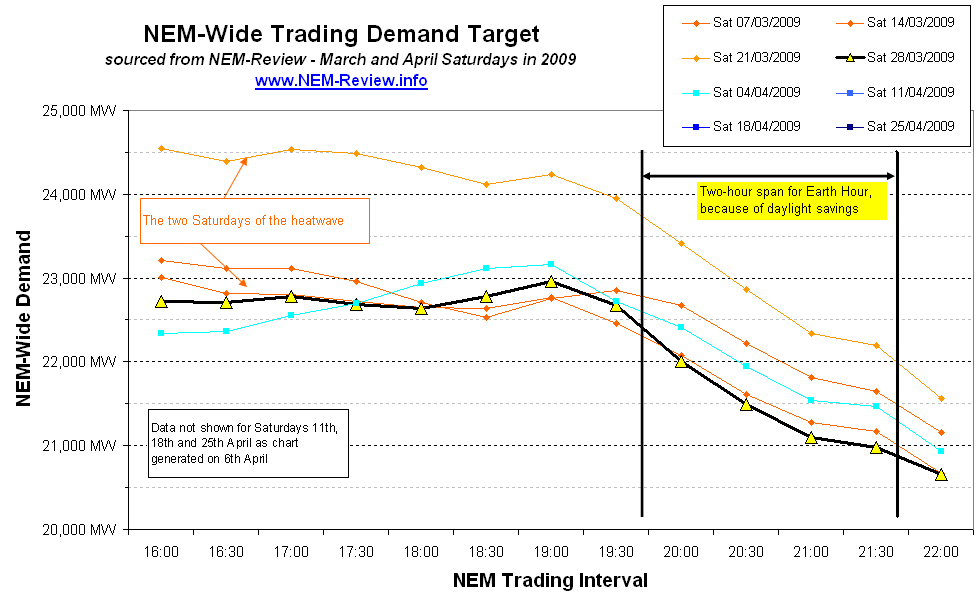
Similarly, you can compare this chart against the similar one for NEM-wide demand for Earth Hour 2008.
(b) Change in Response 2007→2009
The numbers reported above (and in our similar reviews of 2007 and 2008) indicate that the degree of response was not much different across the 3 years of Earth Hours in Sydney.
This is confirmed in the following chart, where we show the NSW region demand in each of the Earth Hour Saturdays 2007→2009. The two half-hours corresponding to Earth Hour results have been highlighted for each year.
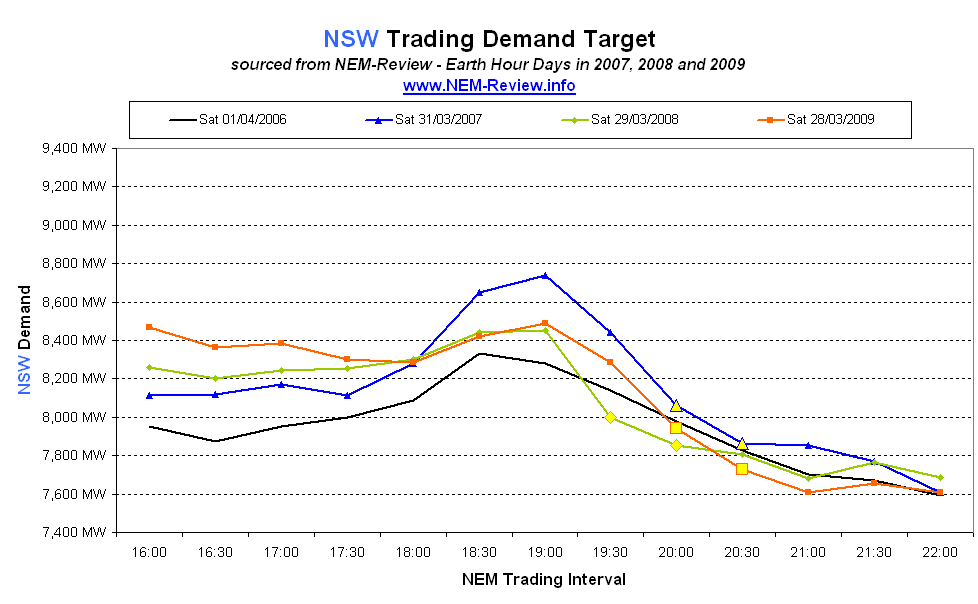
We’ve also included a similar Saturday from autumn 2006, for comparison.
In the chart we can see that there is a distinct response achieved on each occasion – however the response certainly did not increase markedly from 2007 to 2009.
This would tend to imply that the added publicity garnered by Earth Hour around the world in 2008 and 2009 did little to increase the response delivered in Sydney. As did David Solomon, we find Earth Hour a unique social experiment – and one which seems to have highlighted a natural limit to the amount of responsiveness that can be delivered easily by electricity users.
(c) Playback in NEM-Watch
Out of interest, we saved a “playback” of Earth Hour 2009 in NEM-Watch v8 and have included it here, for your reference:
If the page does not load, you can also find our record of Earth Hour 2009, playback through NEM-Watch here.
(Yes, we accept that it’s hard to see any specific Earth-Hour effect in this movie – we just thought to add it in to highlight the inter-relatedness of different aspects of Australia’s National Electricity Market).
6) A few thoughts in conclusion
Please note that these comments have been made on the following starting assumptions:
- That anthropogenic global warming (AGW) is happening;
- That the likely costs of AGW necessitate taking some action now to alleviate the worst of these effects.
If we assume this for a starting point (and that should not be taken to imply that we either believe them, or not), then we would like to make the following comments about the usefulness of the Earth Hour concept.
(a) A success in Raising Awareness
Given the success the organisers have had in increasing the number of cities that have participated around the world,
Beyond just raising awareness, it seems to us that the past 3 years have seen an increased level of understanding on the part of the broader community with respect the climate change debate.
Note by “climate change debate” we mean more than just the ongoing to-and-fro about whether either AGW is happening, and whether it’s worth doing something about it.
What we mean, instead, is that the population understands more of what the “addressing of climate change” would really entail now (than was the case more than 2 years ago).
As noted above, even just the improvements in (most of) the criticisms directed at Earth Hour is indicative of how the standard of the debate has improved in the past 2 years.
Whilst there are a number of other initiatives that have also had some effect on increasing the public’s understanding of the issues (Al Gore’s film, reports by Stern and Garnaut, etc…), it does seem that Earth Hour has played a significant role in facilitating this change.
Hence, credit should go to the organisers on that point.
(b) Beyond the Symbolism
Most commentators (no matter their point of view about AGW) have come to accept the fact that Earth Hour is a largely symbolic occasion.
We stumbled upon this commentary by Joseph Wakim on the ABC that contains some very good points (at the bottom):
Firstly, Joseph points out that:
Earth Hour felt more like us doing good for ourselves and patting ourselves on the back rather than doing good for our planet. It reminded me of some believers who collectively worship for sixty minutes on a weekend, feel great that they have paid their dues and cleared their conscience, then return to their habitual lifestyle. Surely, we should have progressed beyond these gratuitous gestures by now.
This is perhaps the biggest challenge for the organisers, as they look forward to an updated kind of event in 2010.
However Joseph continues:
The Earth Hour web-site called on people to “vote with their light switch for action on climate change…switching off your lights is a vote for Earth, or leaving them on is a vote for global warming”. This rang out like the Bush ultimatum – ‘you are either with us or with the terrorists’.
We agree – but would go further, to reiterate the comments we made in our review of Earth Hour 2007 that the event seems to have had the effect of polarising those at both extremes of the debate.
Given the success of Earth Hour (at least in terms of raising awareness and encouraging this debate) it would seem to us that future events will need to be planned in such a way to manage this antagonism, such that it does not get out of hand.
i. Lower reductions away from CBD
From our reviews of the three successive Earth Hour events, it does appear that the reduction achieved was greatest within the CBD area.
This does make sense, intuitively, because:
- (We believe that) lighting forms a higher percentage of the CBD’s total energy usage, compared with energy usage in the suburbs, and in rural areas:
- Social pressure would have been higher for CBD residents (and businesses) in persuading them to participate in Earth Hour; and
- Results may also have been skewed because of the relatively higher environmental consciousness of people living in the CBDs.
Any serious attempts to reduce Australia’s greenhouse gas emissions will obviously need to take this factor into account.
ii. 10% reduction not improved upon
As noted above, over 3 successive years it has appeared that the level of response in the Sydney CBD is “stuck” at around 10%, and similarly “stuck” at a similar level of response across NSW (perhaps 200MWh).
It would seem that the added publicity has not had any noticeable effect on:
- Significantly increasing the participation rate; or
- Significantly increasing the average response per person.
This second factor is somewhat surprising, given that survey responses indicated that more people had done more than just turn off their lights in 2008 (we did not find survey results for 2009). It may be (though we are just speculating) that this increased response (on behalf of some people) was offset by a reduced response (on behalf of others) who perhaps grew less enamoured with the concept (though remaining committed enough to call themselves “participants”).
iii. 5% Annual Reduction target dropped
When Earth Hour 2008 was conducted, businesses that signed up were asked to also find ways to save 5% electricity consumption across the year.
However, with Earth Hour 2009, that aspiration was dropped – as Andrew Bolt noted in this blog post:
WWF Australia, which organises Earth Hour, says it won’t bother this year to ask the sponsors to pledge to cut their gases. “We’ve decided we’d actually downplay (real cuts) this time,” boss Greg Bourne has confessed.
(We had a quick look, but could not find an original source for this quote).
We would infer, from this, that the performance of these participating businesses against these longer term goals was not flattering.
If businesses had signed up (in Earth Hour 2008) and yet not achieved their performance targets, we would think that a report of these results (even if aggregated up) would be of value, moving forward, with respect to achieving meaningful reductions.
iv. Converting Attitude to Action
We noted above the ongoing discrepancy noted between professed involvement rates in Earth Hour and either or both of the actions that, when taken at a personal level, would result in reduced greenhouse gas emissions:
- Reduction of aggregate consumption of energy (per person or household); and
- Switching to renewable sources of energy through Greenpower accredited suppliers.
(c) Hence, what’s next?
It follows from the issues outlined above that the next Earth Hour event will need to incorporate significant changes, if it is to provide any real tangible benefit, longer term, in terms of greenhouse gas reductions.
Without some evolution, it may be that Earth Hour will quickly devolve (if not already) into just another “feel-good festival” – which may be beneficial in fostering a community spirit (in the same way as the showing of Christmas lights does, or New Year’s Eve fireworks), but achieves little sustainable benefit for the environment.
i. For Sydney
Given that the Earth Hour movement began in Sydney, it is logical to think about “what’s next” specifically with respect to Sydney for several reasons:
- Sydneysiders will have had the greatest experience with the event and so should (in theory) be most responsive to the changes; and
- People around the world will logically look to what’s happening in Sydney as a guide for what to do next.
The big challenge, however, is what to change.
Given the most telling criticisms of Earth Hour, in its current format, it would seem logical for the event to evolve in two ways:
- Firstly to change from a simple focus on just a single hour’s consumption to a longer time period (i.e. perhaps Earth Hour becomes Earth Day in 2010);
- Coupled with this change, the challenge (to participants) would be to devote extra focus, on that day, on reducing their consumption during the course of doing their “normal” daily activities (i.e. take the focus of lighting, and change it to those aspects of each person’s life that do generate the most emissions).
In doing this, the event would also evolve, in a meaningful way, from being simply a symbolic spectacle (where reality stands still for an hour) to a day in which the participants can genuinely see how sustainable changes in their lifestyle can impact on their energy consumption.
ii. Elsewhere
Some of the keener international cities and regions might take the lead of the evolution to Earth Day.
It may be that, coupled with this focus, the migration of Earth Hour around the world (to previously uninitiated countries or regions) will play its role in raising initial awareness of the issues.
iii. Earth Hour Website
Additionally, coupled with a more practical (less symbolic) approach suggested above, the Earth Hour website could also change from being what seems another social networking feel-good site, to one which:
- Is more directly focused on facilitating an individual’s search for emission reductions; and
- More directly facilitates an individuals recording (and sharing) of the measure of the emissions reductions achieved personally.
The two photos in this article were both taken on the same camera and accurately reflect the differences in switched on lighting in Brisbane at the time.
The reason that they use different exposure times is that the fifteen second exposure shots I took during earth hour were over-saturated by the reflected light from the cloud cover.
The only alteration performed on the photos after they were taken was some slight angle correction due to my camera not being perfectly level when the photos were taken.
I was personally quite surprised at the level of lighting reduction during earth hour. Even after earth hour had finished there were less lights on in the city than there were the night before.
Disclaimer: I am personally skeptical of the benefits of earth hour and did not participate in the event, except to take these photos.
Guys, this is a fascinating analysis. Keep up the good work.
Thanks Brenna,
Unfortunately only get time to do this kind of thing in between our “”real work”” of software development. Hence, posts will continue to tend to be sporadic!
Cheers
Paul