Summer 2007-2008 has been one of the mildest in recent years (for Queensland at least).
As a result of this mild weather, demand for electricity has been fairly modest, and instances of price volatility have been fewer than in some summers past. However, for a couple of days in late February, summer finally arrived, and struck with a vengeance.
| On Saturday 23rd February (and for what seemed like the first time all summer), temperatures in South-East QLD soared above 40 degrees (and were high outside of the south-east corner as well). These extreme temperatures were forecast by the Bureau of Meteorology several days previously, so the market had plenty of time to prepare for their onset.The “National Weather” illustration provided here was taken from the NEM-Watch application around midday, which was when prices first started to spike (in QLD). By midday, demand in the QLD had almost reached its peak for the day of 8,000MW (which was very high for a Saturday, and only 500MW lower than the all-time maximum demand for QLD). In contrast, however, temperatures in the southern states were very mild – these are also shown in the illustration. These mild temperatures had a moderating effect on the overall level of electricity demand right across the NEM.
As a result of this moderate weather in the southern states, NEM-wide demand was very modest, as shown in the indicator for Instantaneous By way of comparison, a peak NEM-wide demand as high as 33,000MW would not have been unreasonable for this summer, given how quickly it had been growing in recent years. Hence, a NEM-wide demand of only 24,703MW was very modest. As shown in this illustration, there was 12,500MW of spare capacity (i.e. 37,208 available – 24,703 demand = 12,505MW spare). This “spare” capacity was bid available to the market, but was not needed to be dispatched in order to meet demand). As such, the NEM-wide IRPM was as high as 51% at the time (i.e. 12,505MW/24,703MW). Hence, this was a very comfortable position for the market to be in, and was typical of lower-demand days, such as weekends. |
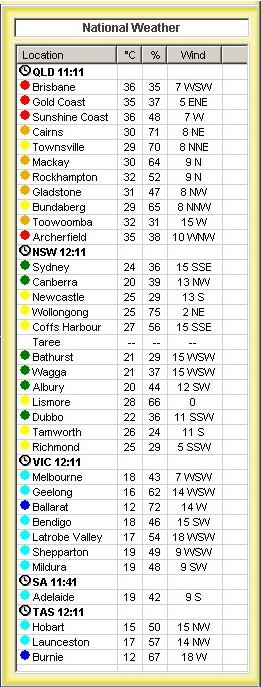
This “National Weather” tile is updated from information published by the Australian Bureau of Meteorology, and is included in NEM-Watch as a service to our clients, given how the demand in the NEM is so dependent on weather patterns around the country. The update times shown for each state are the update times for capital city data updated by the BOM, and are shown in their respective local times. |
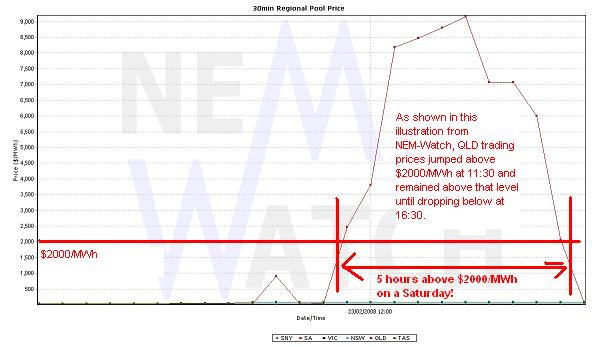
| Yet, as can be clearly seen in the attached illustration from NEM-Watch, the QLD dispatch** price at 11:55 had already reached $4994.95/MWh, and was to remain high for about 5 hours (as shown in the chart below, which illustrates QLD trading** prices).** Click here if you would like an explanation of the difference between Dispatch and Trading data in the NEM |
 |
|
|
|
Furthermore, at that point in time (as can be seen in the diagram below, taken from NEM-Watch) even just within Queensland there was in excess of 2000MW in “spare” capacity available:

One would normally think that, with this much capacity available, prices should be much more modest.
So what caused the prices to be so high, and for so long, when demand was so modest and there was plenty of capacity available?
To understand why prices were able to jump so high during the day, we need to look at two key pieces of data – interconnector flows, and generator dispatch.
1) Interconnector flows into Queensland on 23rd February

In the NEM, it will generally be a single generator that sets the marginal price for electricity all the way across the NEM, with the regional prices differing by just a dynamic inter-regional loss factor (that is a function of the flow on the line).
It is important to note that generators are paid for their production based on the price at their Regional Reference Node. Hence, generators in NSW are paid the NSW price when there are no transmission constraints.
However, when interconnectors are constrained, the prices across the constrained interconnector can separate, as the marginal increment to demand must be met by a local (i.e. unconstrained) generator.
Hence, in the case shown here for 11:55 on Saturday 23rd, it would have been a generator in QLD setting the Queensland price at $4994.95/MWh, whereas it would have been a generator somewhere in the southern regions setting the NSW price at only $29/MWh.
In other words:
1) Even though there was 10,000MW of “spare” capacity spread across NSW, Snowy, VIC, SA and TAS (i.e. the 12,500MW total spare less the 2,300MW spare in QLD), this spare capacity could not be used to keep a lid on prices as no more power from the southern regions could be exported to QLD.
2) As such, the generators in Queensland had local market power for much of this afternoon, as QNI was contrained for all of this period. Because the generators in QLD did not have to compete against generators
in NSW (and beyond) in the supply of power to QLD consumers, it gave them an opportunity to secure higher prices for the power they generated during the period.
Recall, though, that there was still about 2,300MW of spare generation capacity available in QLD at 11:55, which is a significant amount, and which would have been shared across a number of competing (QLD-based) generation companies. In normal times, it would be expected that this amount of surplus capacity would work to ensure lower prices.
Evidently this was not the case on Saturday 23rd February. To understand why, we need to look at the behaviour of individual generation companies.
2) Queensland Generator performance on 23rd February
In the following table, we show some analysis performed with the NEM-Review software to highlight how individual QLD generation stations performed throughout the day. These are listed in alphabetical order.
For each of these charts, we have included QLD price, demand and available generation over the 4-day period (shown in purple for Thursday 21st to Sunday 24th) in order to provide a reference point to the analysis. In addition, on each chart we highlight the declared available generation capacity for the station (i.e. the aggregate capacity bit in at any price), along with the dispatched output.
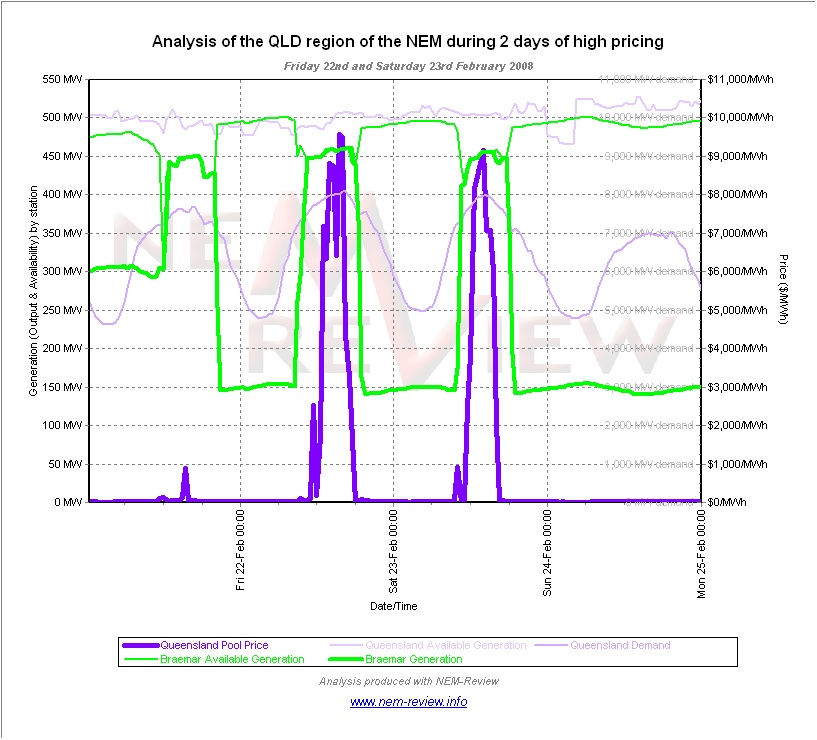
Braemar Station
The Braemar plant is a large open-cycle gas turbine plant operating near Dalby, in
Southern Queensland. It is a joint venture operation of ERM Power and Babcock & Brown Power.
It is traded through a joint-venture trading entity, NewGen Power, and is bid to take into
account the long-term Power Purchase Agreement in place with Sun Retail (part of Origin Energy).
The chart for Braemar highlights some interesting points of information:
1) On Thursday, Friday and Saturday, we see the QLD demand was considerably
higher than the demand experienced on Sunday. Some proportion of this increased
demand was due to the higher temperatures experienced on Thursday, Friday and
Saturday;
2) On Thursday, Friday and Saturday, we see that the declared available generation capacity
at the Braemar plant reduced significantly at the same time as they QLD demand rose.
3) Coincident with this drop in availability, the output of the plant picked up
on all three days to reach its maximum declared generation capacity for those periods.
It is possible (though this has not been verified) that this drop in availability may have been due to thermal limitations on the plant (the higher the ambient temperature, the lower the capability of open-cycle gas turbines), as it was hot on all 3 days, whereas Sunday was cooler.
Further investigation (of individual unit output within NEM-Review) reveals that NewGen appears to only adjust available generation capacity to a practical limit when the plant is operational (i.e. when the plant is not operational, the availability is set to its rated capacity of 173MW). This explains the changes seen in this chart here (i.e. the periods of generation output of around 150MW
occurred when only one unit was operational, as a result of which availability was declared to be 20MW higher on each of the other 2 units).
Callide B Station
The Callide B plant (located near Biloela in central Queensland) is part of the CS Energy portfolio**. Callide B consists of 2 x 350MW coal-fired units.
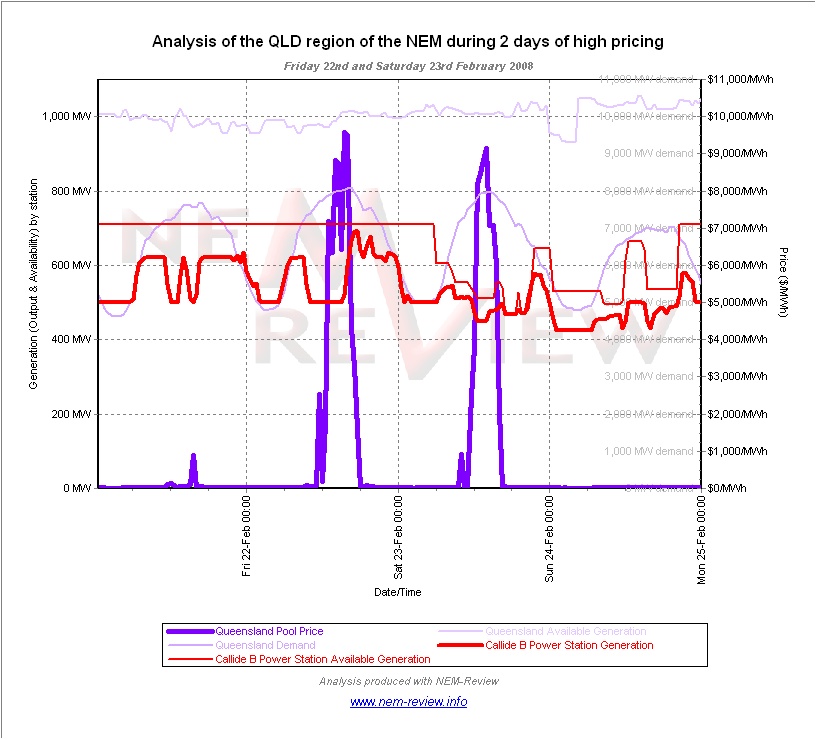
Several observations can be made from this illustration of the output and availability at Callide B station, as follows:
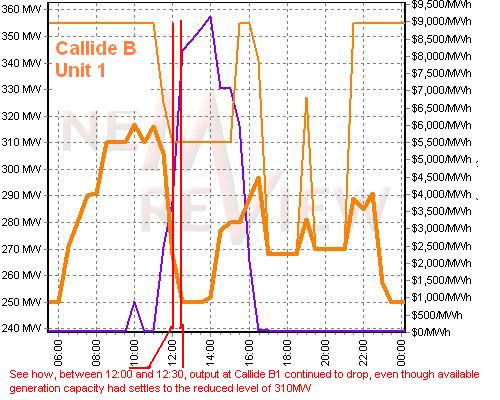
1) On Friday 22nd (which also saw high prices) the 2 units at Callide B were fully available, and yet output dropped in the middle of the day, slightly preceding the sharp jump in prices (output at the station reduced in the 10:30 trading period, whereas the price did not spike until 11:30). This tends to imply some “Strategic Withholding of Capacity” occurred on the Friday.
2) In contrast, on Saturday 23rd, we see that availability of the station dropped by around 200MW:
(a) This reduction in capacity meant that Callide B had less to offer to the market during the peak demand/price times;
(b) The cause of this reduced availability has not been investigated – it’s possible it might be related to the high temperatures, in some way.
3) Despite this reduction in available capacity, it does appears that some amount of Economic Withholding of Capacity was still prevalent on Saturday the 23rd:
(a) As the station was not fully dispatched, even when prices were high, it appears likely that the some capacity was still offered to the market at siginificant prices;
(b) Furthermore, if we look in detail at the output of each of the units individually at the time when the spike occured, we can see that output of Unit 1 reduced when prices increased.
As such, it does appear that CS Energy did help to push the price higher by shifting blocks of generation into higher priced bid bands.
Callide C Station
The Callide C plant (located in central Queensland) is an joint venture operation of CS Energy and InterGen. Both parties effectively own half the output of both stations.
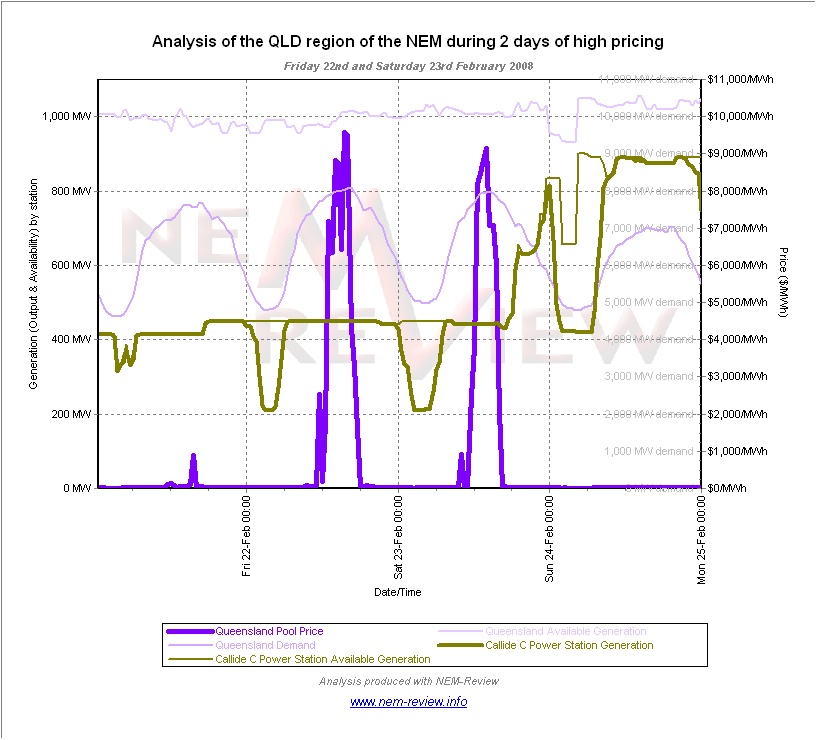
As can be seen in this chart, the capability of the Callide C plant was reduced to single unit capability on Friday 22nd and Saturday 23rd.
Further analysis reveals it was unit 3 that was offline until just after the price dropped. This seems to be an unfortunate coincidence, given the spot revenue forgone for this unit.
For the unit which was available, the stations output implies that it was running as a price-taker in the market.
Collinsville Station
The Collinsville plant (located in north Queensland) is an older, smaller coal-fired plant now owned and operated by Transfield Services.
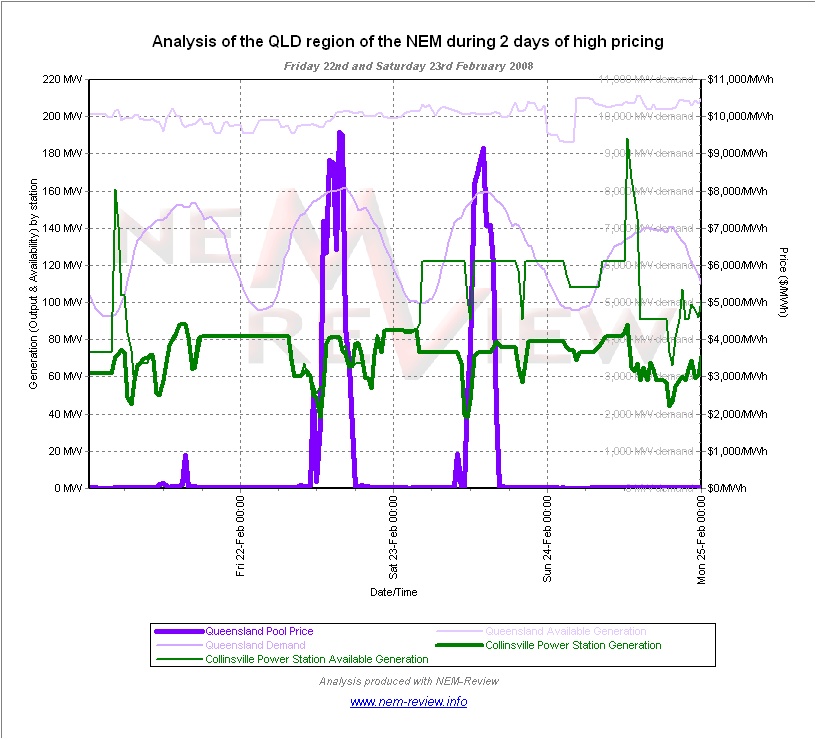
As can be seen in this image, the available generation of the Collinsville plant was raised significantly (keeping in mind that this is a relatively small station) over the weekend, and yet the actual output of the plant dropped.
Gladstone Station
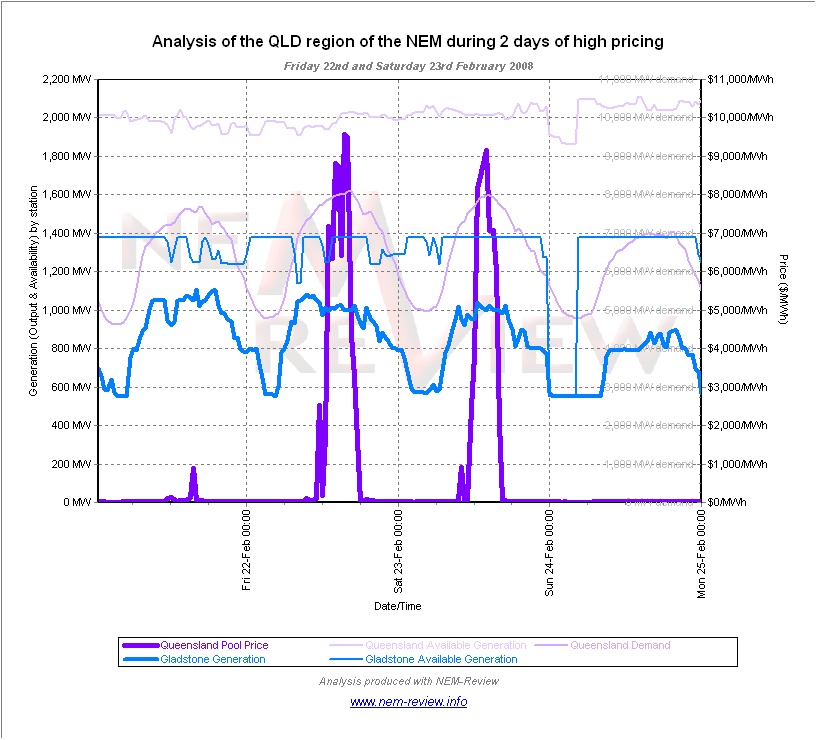
The Gladstone plant (located in central Queensland) is an coal-fired plant which is owned by a consortium including NRG and Rio Tinto Aluminium, and is operated by NRG.
The PPA put into place when the station was sold in 1994 is now operated by Stanwell Corporation (having been novated from the now-defunct Enertrade business in 2007).
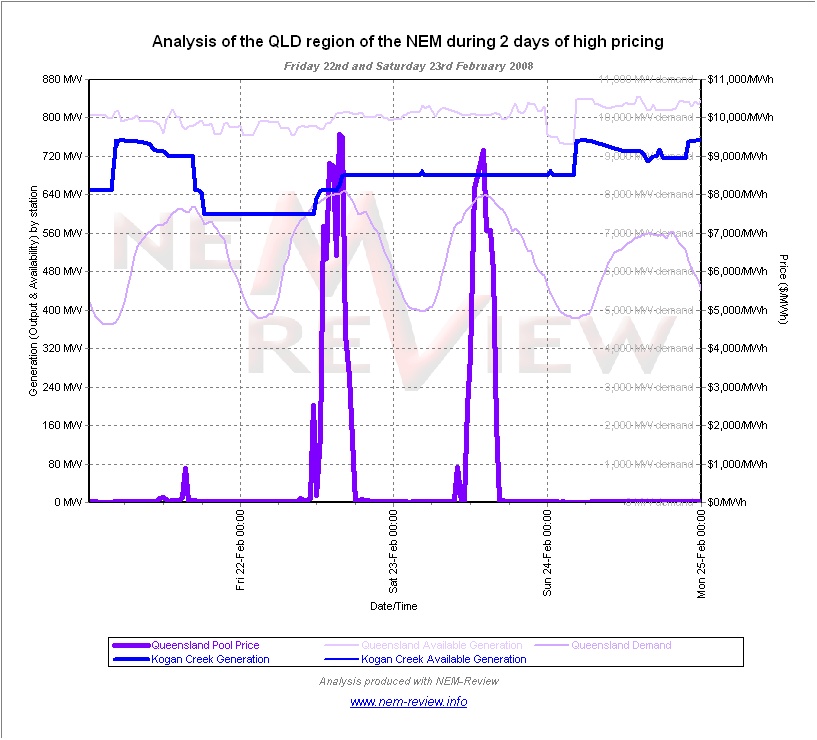
Kogan Creek Station
The Kogan Creek plant (located in southern Queensland) is the newest coal-fired plant built in the NEM. It is owned and operated by CS Energy.
As can be seen in this trend of output and availability at Kogan Creek, the plant ran at its full capability across the 4-day period.
It is noted that the capability of the plant did vary considerably over the 4-day period, such that its capability during the Saturday period was 80MW lower than its rated capacity – the reasons for these swings in capability have not been investigated, but might be (at least in part) due to the limitations on the plant resulting from it being dry-cooled (because it uses ambient air for cooling, instead of the cooling water used in most other stations in the NEM, the extreme weather on Friday and Saturday would have reduced the capability (and efficiency) of the plant).
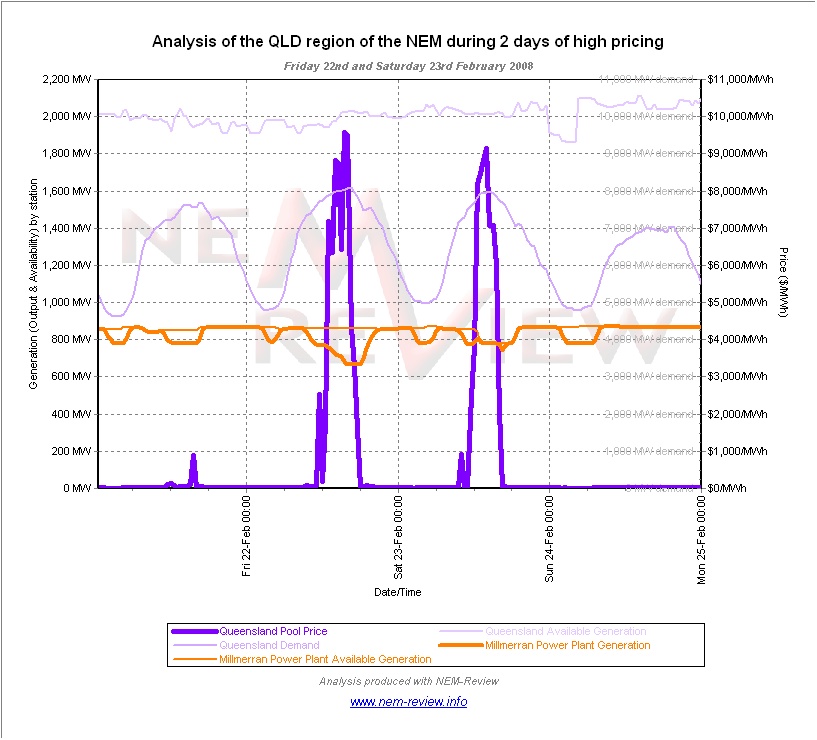
Millmerran Station
The Millmerran plant (located in southern Queensland) is the 2nd newest coal-fired plant built in the NEM. It is owned and operated by a consortium of parties, headlined by InterGen.
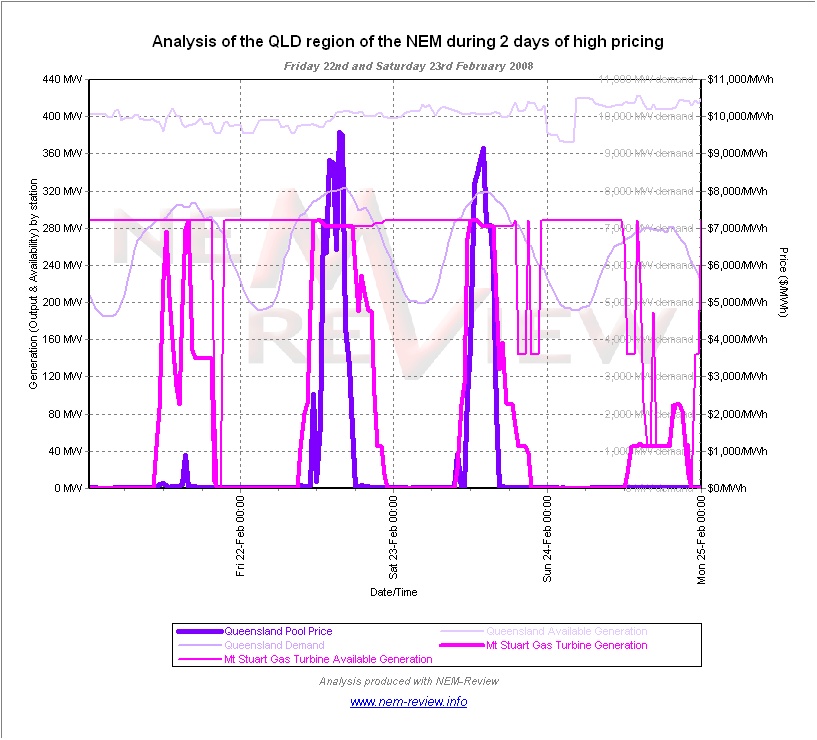
Mt Stuart Station
The Mt Stuart plant (located in Townsville) is a 2-unit arrangement of open-cycle gas turbined configured to run on liquid fuel. Since mid-2007, it has been owned and fully operated by Origin Energy (prior to that time it was dispatched by Enertrade under the PPA that was in place at that time).
Because the station is open cycle, and burns liquid fuel, it has a relatively high short-run marginal cost – and, as such, is run as a peaking station.
Since Origin have taken full control of the station (following the buy-out of the PPA) the station has been operated in a slightly different manner, given the different commercial drivers in place. As can be seen in this illustration, Mt Stuart was fully dispatched on Friday and Saturday (to meet the peaks in price) – and also heavily dispatched the preceding Thursday, when there was a smaller spike in price.
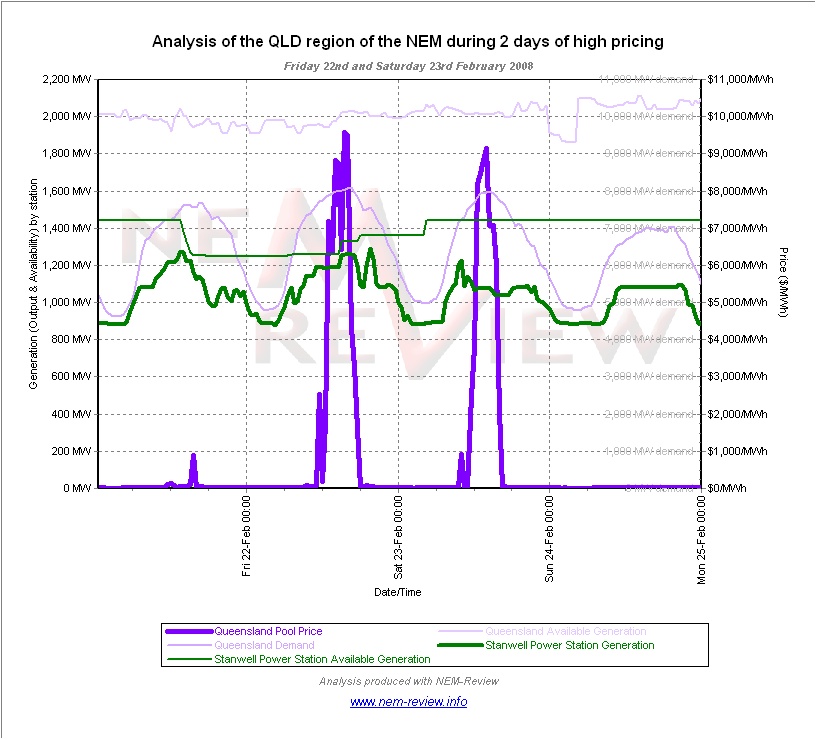
Stanwell Station
The Stanwell plant (located west of Rockhampton in central Queensland) contains the last 4 of 10 x 350MW units constructed by Hitachi in Queensland in the period 1980-1997.
It is owned and operated by Stanwell Corporation. Up until late 2007, Stanwell was the only major-sized generator in the Stanwell Corporation portfolio, but the addition of the trading rights for the Gladstone PPA has changed the commercial position of the Corporation (given it now controls 2 large-size stations in central Queensland, both of which operate as mid-merit generation and so will be involved in setting the spot price).
As can be seen in the illustration of Stanwell’s output and capability, the station was not operated at full capacity over the period of the price spike on Saturday.
Note that the situation was different on the Friday 22nd February, where output was closer to capability – further analysis reveals that Stanwell Unit 3 resume full capacity during the day on Friday following a 24-hour period where its capability was reduced to half-load, for reasons unknown.
In contrast, on Saturday the capability of all 4 units was declared as 360MW each, whereas the output of all 4 units was around 270MW at the time of the spike in demand. From this it can be inferred that the Stanwell station had a large amount of capacity bit at, or around VOLL, and so helped to push the price up.
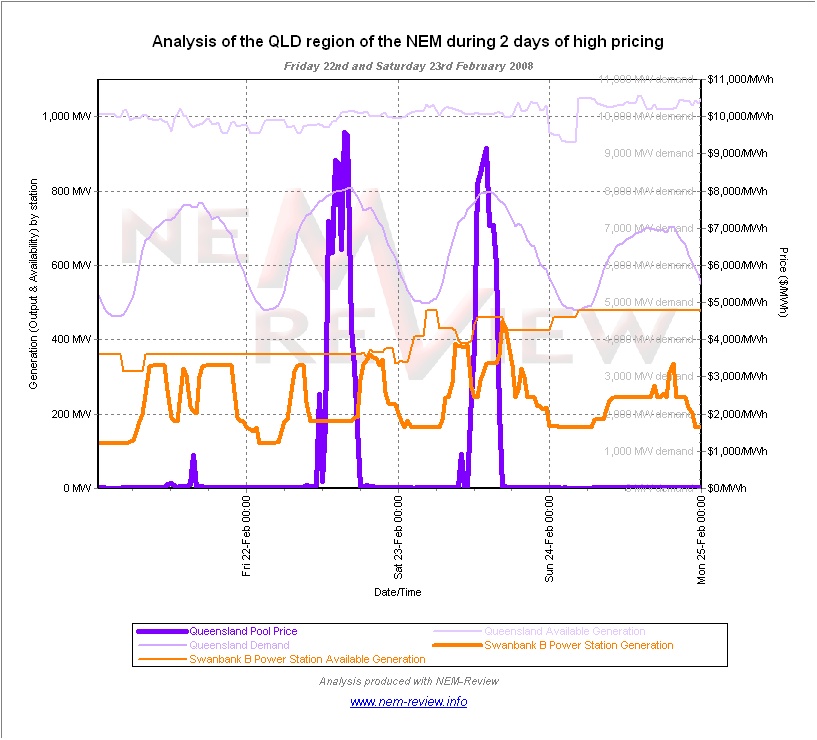
Swanbank B Station
The Swanbank B plant (located near Ipswich in south-east Queensland) is one of the oldest coal-fired plants still operating in Queensland. It is owned and operated by CS Energy.
As can be seen in this trend of output and availability at Swanbank B, the plant provided reduced output to the market when the price was high in behaviour that was consistent across the price spikes that occurred on Thursday, Friday and Saturday 23rd February. As such, it can be inferred that CS Energy utilised the Swanbank B plant to assist in delivering high spot prices in the market on this period.
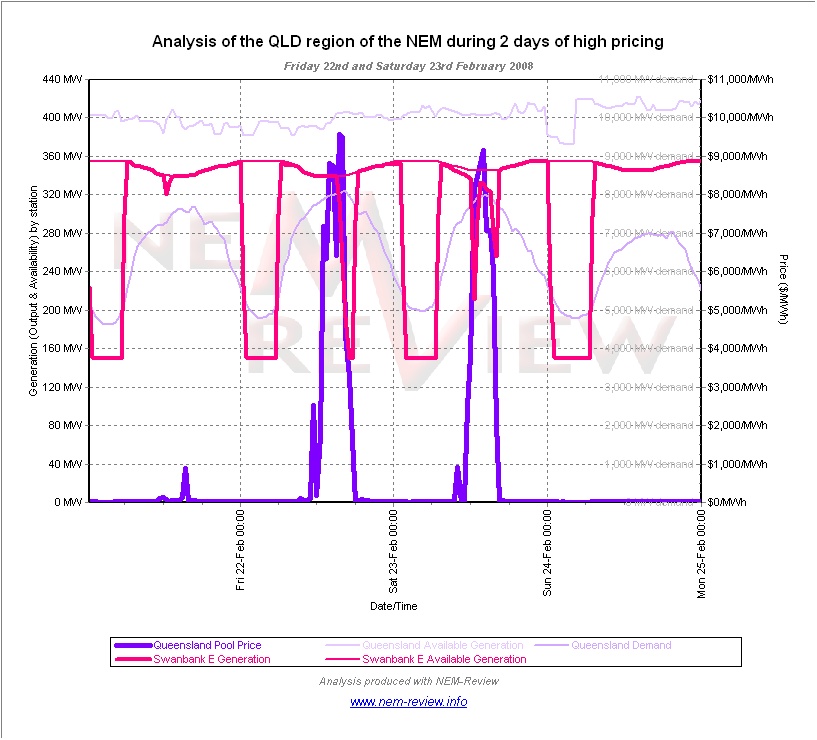
Swanbank E Station
The Swanbank E plant is a newer combined-cycle gas turbine plant that sits next door to the Swanbank B plant. It is owned and operated by CS Energy.
As can be seen in this trend of output and availability at Swanbank E, the plant operated similar to the profile of Swanbank B, in that its output reduced at times of peak pricing, with the reduction clearly evident on Saturday 23rd.
Whilst it is possible that high ambient temperatures may have had some impact on the capability of the station, it is thought that the reduced output at the plant is indication of “Economic Withholding of Capacity” over the period.
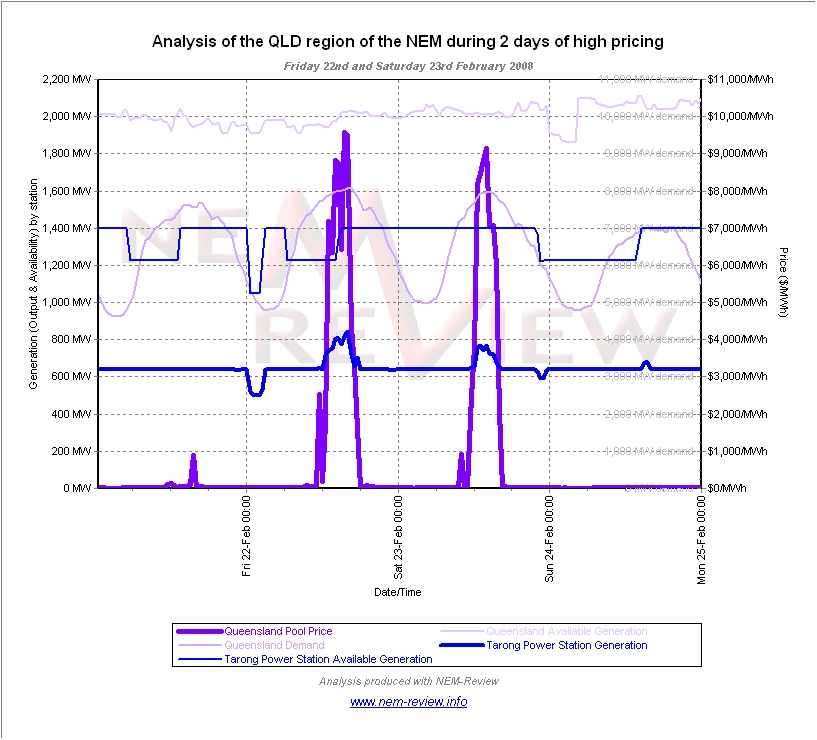
Tarong Station

As can be seen in this trend of output and availability at Tarong, the plant consistently ran at a low capacity factor, and increased its output slightly in response to the high prices.
Further analysis in NEM-Review reveals that all 4 units were running over the period, but at minimum load.
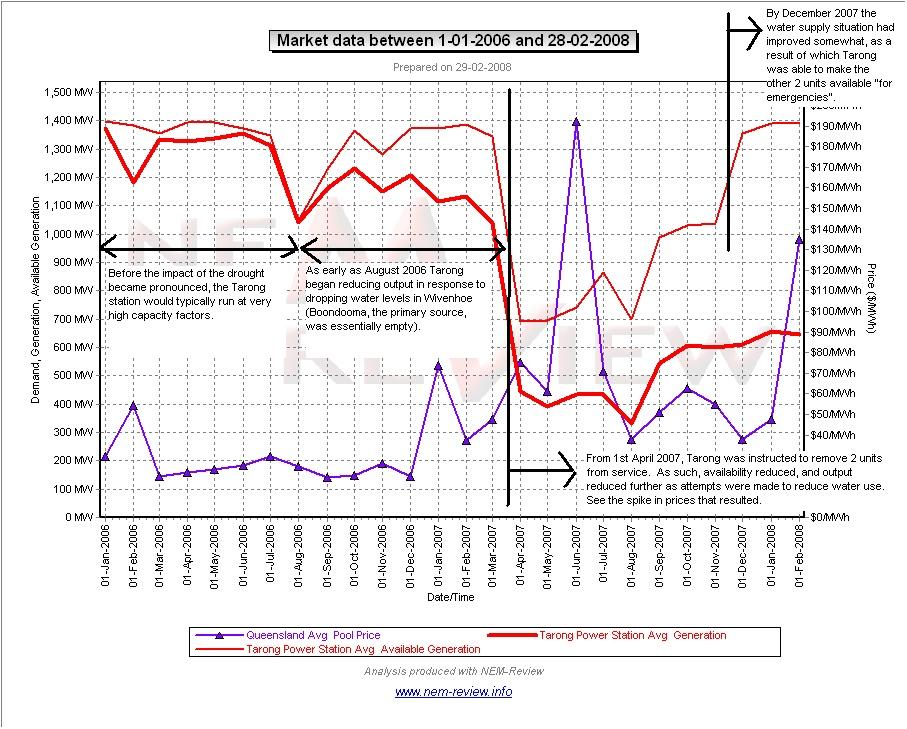
You may recall that, from April 2007, Tarong had been instructed to reduce its output as part of a co-ordinated effort to conserve water in Wivenhoe Dam (Tarong’s back-up source of water). From that time, Tarong’s output had reduced markedly, as shown in the chart on the right.
Given the rain received in recent weeks in South-East Queensland, the water levels have increased significantly in:
- Boondooma (the primary source of water for Tarong; and
- Wivenhoe (the back-up source of water).
As can be seen in this chart, however, by the 23rd Tarong (only 11 days later) had not yet ramped up its production.
Click on the image for a closer view
Tarong North Station
The Tarong North plant (located across the road from Tarong Station) is a single-unit, supercritical station owned by Tarong Energy, Mitsui and TEPCO, and is traded in the market by Tarong Energy.
As can be seen in this trend of output and availability at Tarong North, the plant has been operating at maximum rated capacity during the day, just reducing load overnight. There was no change to this operational pattern that might suggest the station was used in order to escalate the price on Friday 22nd or Saturday 23rd.




Leave a comment