
As noted on the overview of summer 2006-2007, there was a temperature-driven spike in demand in NSW on Tuesday 21st November 2006. These sweltering temperatures combined with bushfires to cause localised blackouts in the Sydney city area, as reported in the Sydney Morning Herald.
The following chart illustrates how the NSW region of the market operated over the week in question (including Tuesday 21st November):
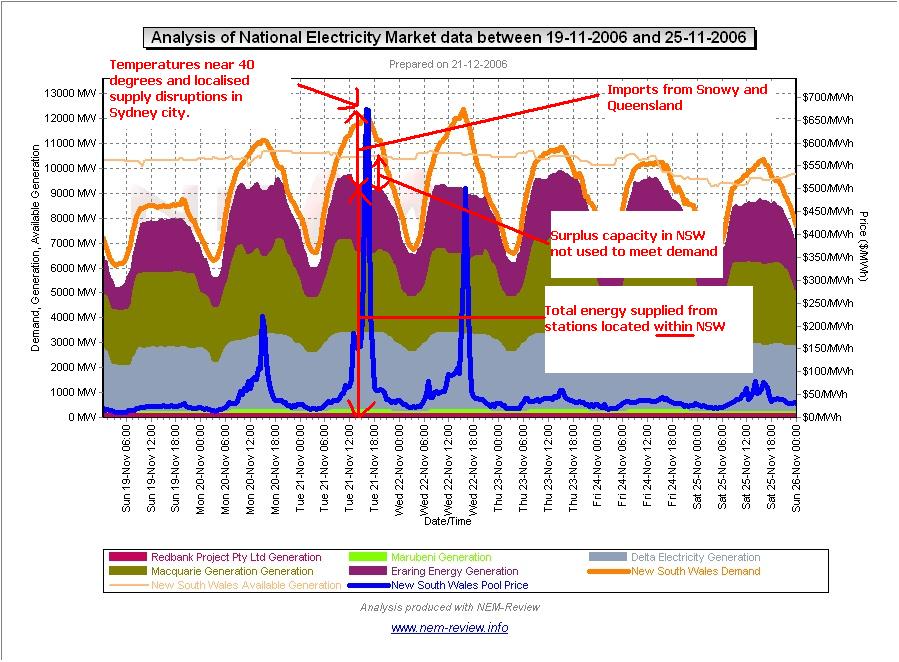
From the chart, it can be seen that:
1) The 3 large government-owned generators supplied the bulk of the power consumed in the region, with the remainder being either imported from Queensland and Snowy or supplied by the private sector generators, Marubeni (Smithfield) and Redbank.
2) The amount of generation supplied, in total, by generators in NSW is below the total capacity declared available to NEMMCO at the time (meaning that NEMMCO found it more cost-effective to meet some of NSW demand by increasing imports from Queensland and Snowy).
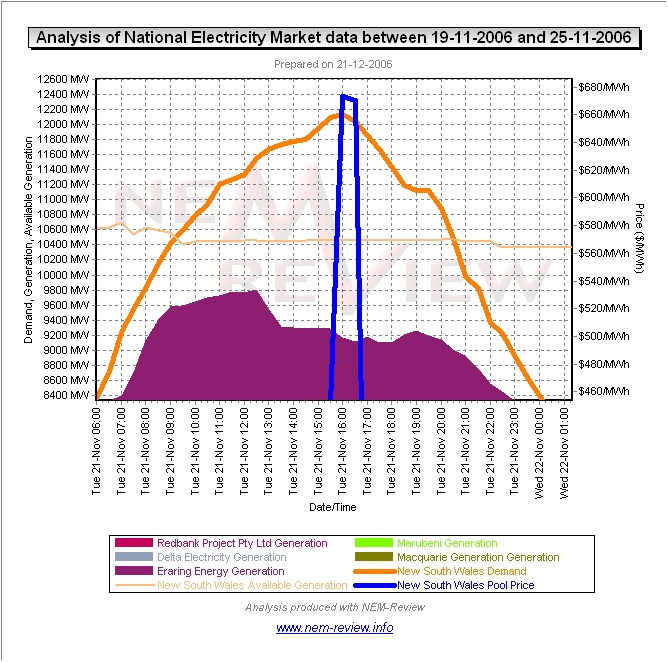
3) If we zoom-in on the time of particular interest within NEM-Review (click and drag your mouse over the area in the chart within NEM-Review), we see the following chart, which illustrates several other interesting points of note:
(a) We can see that aggregate generation output from NSW generators reduced from a peak of around 9,800MW at 12:30 on the day to below 9,400MW of energy by 14:00, and further still through until 16:00 (a total reduction in output of at least 600MW).
(b) This reduction in output preceded the afternoon’s peak in demand and hence, as a result, contributed to the spike in prices experienced at 16:00 and 16:30.
(c) We have not studied this in further detail, but it certainly appears as if some of the generators in NSW were working to force the price up by “economic withholding” of capacity (i.e. shifting generation amounts into higher priced bid bands to make the most of the temporary existence of local market power) You could analyse this yourself, with your own copy of NEM-Review, in the same way as we did for our analysis of 8th December 2006 (in that case in relation to generators in South Australia).
For a closer look at what was happening across the NEM during the afternoon, we have included a snapshot taken with NEM-Watch of the action in the market
Please click on the image for a better view
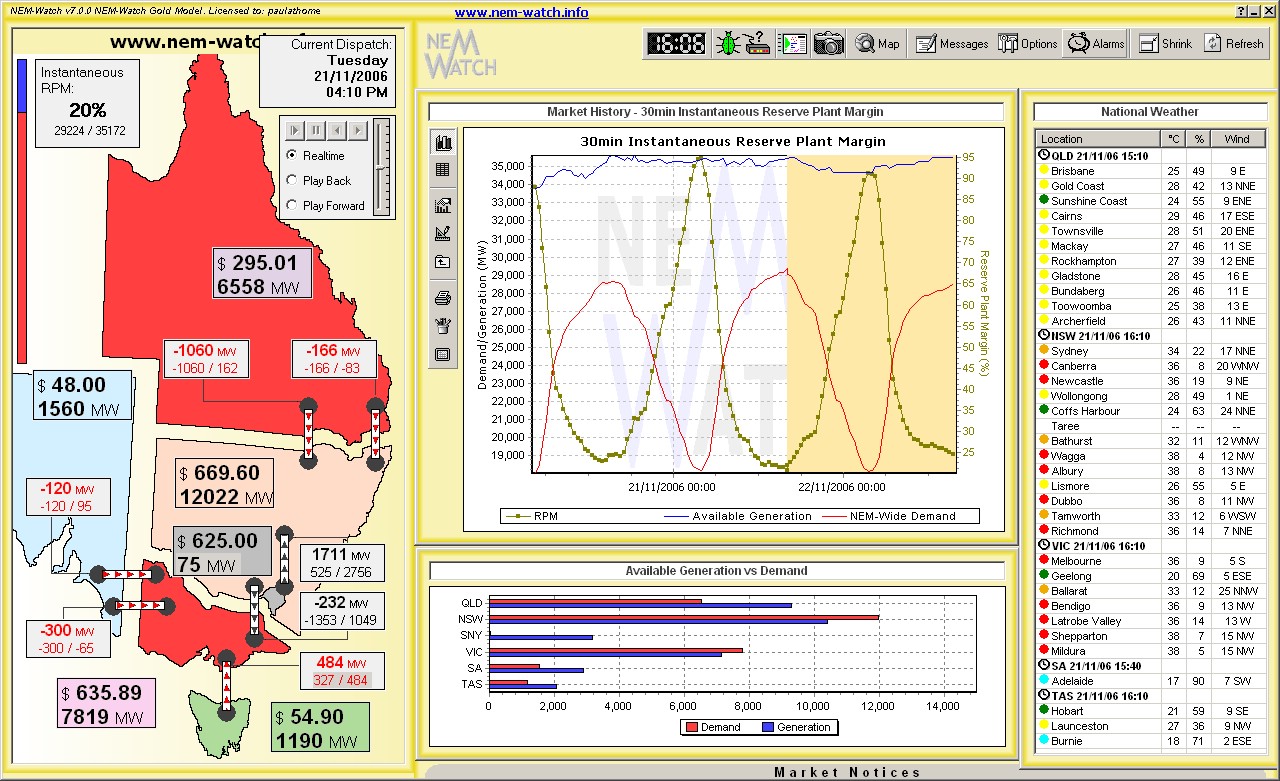
(This image has been taken from a BETA of NEM-Watch version 7, which we have been running for testing purposes)
On this NEM-Watch snapshot, you can see:
1) High temperatures almost everywhere around NSW and Victoria (with Queensland, South Australia and Tasmania being notably cooler);
2) Coincidentally, prices in NSW, Snowy and Victoria are significantly higher than those in Queensland, South Australia and Tasmania Transmission (in effect, generators in Queensland, South Australia and Tasmania are shut out of the market by virtue of transmission constraints, which are indicated by red arrows on the interconnectors shown within NEM-Watch).
3) As can be seen in the “Available Generation vs Demand” chart, both Victoria and NSW were experiencing a deficit of available local generation capacity, which meant that both regions were (even more than normally would be the case) very heavily reliant on capacity at Snowy to meet the surge in demand.
4) Calculations we have performed off-line using data extracted from NEM-Review indicate that the actual reserve plant margin being experienced in the NSW-Snowy-Victoria group of regions at 16:30 was as low as 17% (and the bulk of the reserves were being held by just three companies – Snowy Hydro, Macquarie Generation and Eraring Energy). This is lower than that noted above for the whole of the NEM, and explains why prices were considerably higher in these regions. These calculations are illustrated below:
5) Given concerns about the low level of water currently stored in the Snowy Hydro
reservoirs (as reported in the Sydney Morning Herald), this does point to serious issues emerging as hydro levels decrease further over summer:(a) Specifically, this would be of concern IF a similar situation should emerge where:
i. High temperatures should be experienced simultaneously in NSW and Victoria; and
ii. The outside regions (Queensland, South Australia and Tasmania) should be unable to contribute any further due to transmission constraints.(b) As can be seen, Snowy hydro plants were supplying 1,200MW of the 3,000MW of reserve capacity in the NSW-Snowy-Victoria group of regions at that time. If this capacity was energy constrained (i.e. had little water with which to generate), the reserve plant margin would obviously have been much lower than 17% apparent in this case, and prices considerably higher as a result.
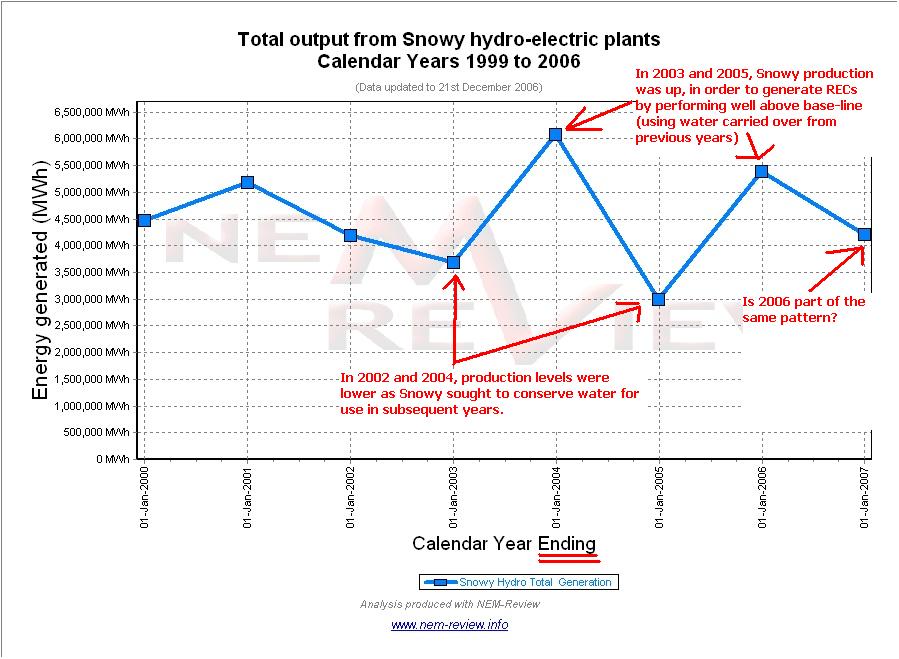
6) One more point worth further consideration in relation to this issue is the approach seen over recent years at Snowy Hydro in cycling output from the hydro plants in order to maximise the production of Renewable Energy Credits (RECs) every second year. Is this approach continuing, and if so, how might this impact on the balance of supply and demand in the NEM?
Be the first to comment on "21st November 2006 – demand spike in NSW"