Paul and the Global-Roam team have produced a great introductory guide to the fundamentals of the NEM’s price setting and dispatch process, and more recently an intermediate guide covering some of the real-world complexities resulting from this process, based on analysis of AEMO’s Price Setter data files.
In this explainer, I want to focus on a few of the key concepts needed to bridge the gap between the basic ideas behind price setting via least-cost dispatch and how this plays out in the results we see in the NEM, as described in Paul’s intermediate guide.
I’ll be covering:
- the underlying principle in the NEM (and many other markets) that spot prices are the incremental (marginal) cost of supplying the next unit of demand,
- how transmission losses, both within regions and between interconnected regions, are treated in the dispatch process and affect NEM price outcomes,
- why, and how, prices in multiple NEM regions can often be set by the same single generating unit or group of units located in just one region, and
- how physical limitations of the transmission network and other constraints can impact on the price-setting process and price outcomes.
In a later followup piece, building on these principles, I intend to cover more complex cases including
- why we not infrequently see prices being set by generating units at multiple stations which may be located in separate regions, and
- how spot energy prices can be affected by the NEM’s associated frequency control ancillary services markets
Least Cost Dispatch – Core Principles
The first discussion point above is crucial, because it underpins just about every other aspect of the price-setting process and outcomes that we see in the NEM.
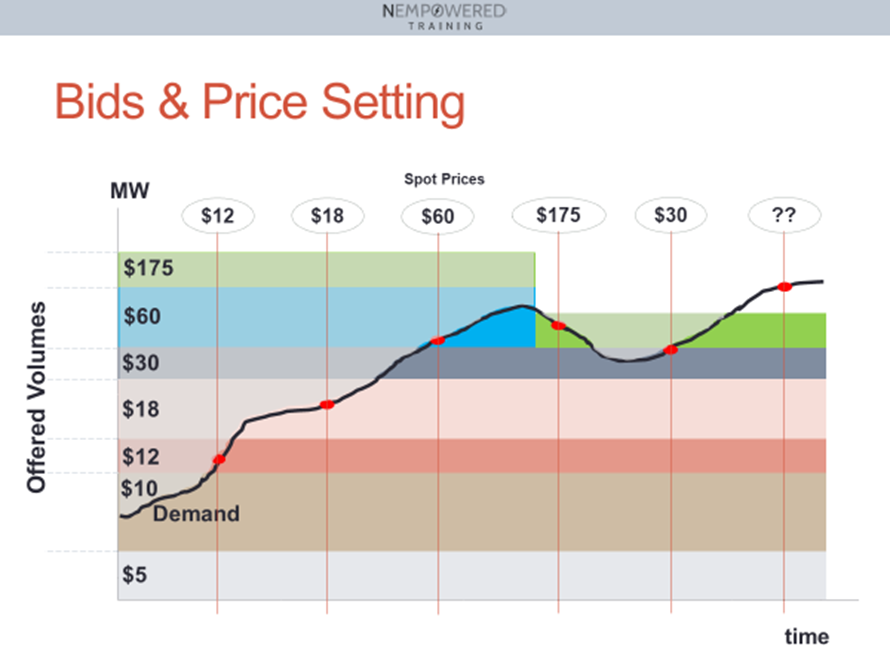
Most of us are introduced to marginally priced markets like the NEM through the “bid-stacking” analogy. Here’s just one of many ways this can be illustrated, showing prices being set over time:
Offers to supply volumes of power are “stacked” like blocks in order of increasing price, with the height of each block representing offer volume, creating a bidstack; the aggregated demand level is overlaid, and just enough offers are accepted – dispatched – so that the cumulative volume of dispatched offers just equals the demand to be supplied at the end of each dispatch interval.
The price of the last, highest-priced offer accepted in each interval – the marginal offer – sets the market price, and dispatch volumes for each supplier are simply the aggregate of its accepted offers.
If we assign a cost to each accepted offer, being its offer price multiplied by its volume (or part-volume in the case of the marginal offer), then two results should be obvious:
- least cost dispatch: for this simple case, dispatching offers by “moving up the bidstack” in increasing price order to meet demand yields the supply combination which has the lowest total cost (where total cost is simply the sum of accepted offer costs), and
- price = marginal cost: the price of the marginal offer which sets the market price is also the marginal (incremental) cost of supplying one further unit of demand (where this unit is just a very small fraction of total demand and typical offer sizes).
Bid-stacking works perfectly well in very simple situations where there are no limitations on which bids can be accepted. But a real world setting like the NEM has many practical limitations. Victoria has enough generation capacity to cover combined Victorian and Tasmanian demand most of the time. But even if all Victorian generators offered at prices below the cheapest Tasmanian generator, it would not be possible for Basslink to physically carry enough power to supply Tasmania by itself. So some Tasmanian generation always has to be dispatched regardless of its offer pricing relative to Victorian generators.
In cases where simple bid-stacking doesn’t readily apply, the principles used for dispatch and pricing still embody the two observations above:
- dispatch is based on the least-cost combination of offers which meets demand and satisfies the physical limitations of the system;
- spot prices are defined as the marginal cost of meeting an additional unit of demand under this least-cost rule, which is the difference in total cost between the original least-cost combination and the least-cost combination for one extra unit of demand.
If you don’t see what I did there, re-read the last point. There’s no reliance in that definition on a single “marginal offer” which directly sets the spot price. Some of the time it may be that simple; in other cases, meeting an additional unit of demand at least cost can involve changing dispatch volumes (and hence costs) by varying amounts across multiple offers within that least-cost combination, with no single offer “setting the price” by itself – examples to follow below.
One final and important point – although the concepts of offer cost, total cost, and least cost used above are based on valuing each offer at its offer price, payments to NEM generators for all offers dispatched in a given region and trading interval are based on the common regional spot price, not their individual offer prices. “Costs” calculated from offer prices are fundamental to the logic of the dispatch process, but don’t represent the financial cost of energy in the NEM. Least cost dispatch with marginal cost pricing is a process intended to foster competition for dispatch and seek the most economically efficient balancing of demand and supply – for more discussion on this topic see Paul’s article on approaches to market dispatch and pricing.
Price Setting in Practice – Intra-Regional and Inter-Regional Loss Treatment
Once you’re across the concept that NEM prices are the marginal cost of meeting one more megawatt-hour of demand, many of the complexities of price setting – and even AEMO’s price setter data – become much easier to grasp.
Let’s start with treatment of losses, both within regions (intra-regional) and over interconnections (inter-regional).
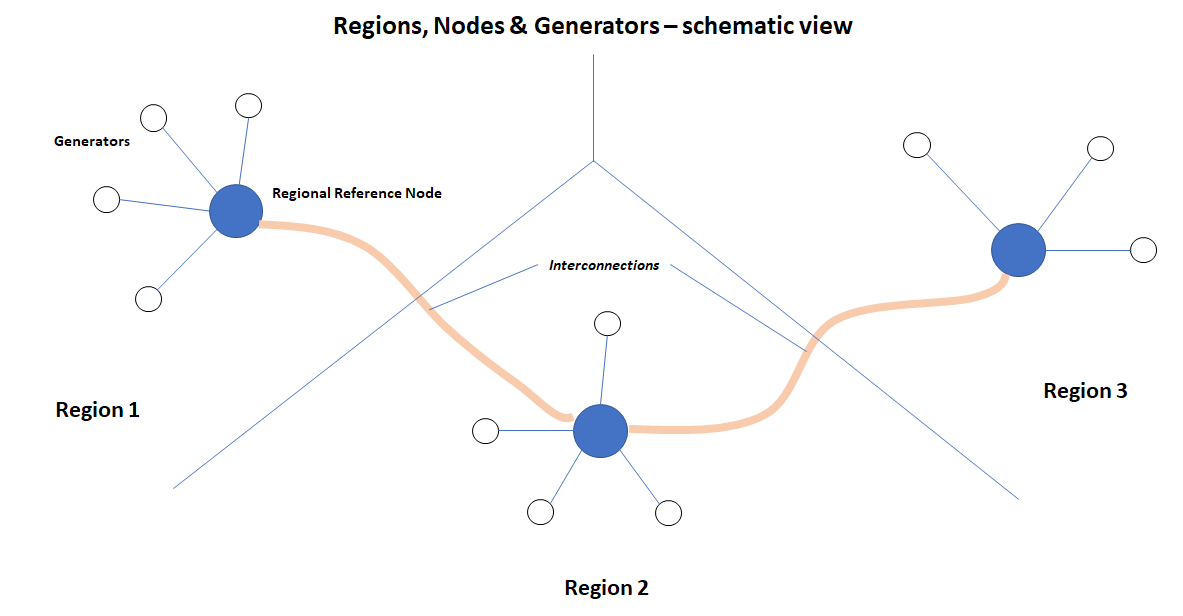
Conceptually, NEM generators and regions look like this in the dispatch process:
Generators in each region are treated like spokes on a wheel, connected to a central hub which is the Regional Reference Node (RRN). These are not physical transmission connections (which are usually a much more complex mesh). The hub-spoke relationships simply assign each generator to one and only one RRN, and also embody Marginal Loss Factors representing the effect of incremental intra-regional transmission losses – under “typical” or “average” conditions. An MLF represents the power that would effectively be delivered at the RRN – after losses – when one additional megawatt is injected at the generator location. (For a great in-depth discussion of MLFs see this recent piece by Ben Skinner of the Australian Energy Council.)
Treatment of Intra-Regional Losses
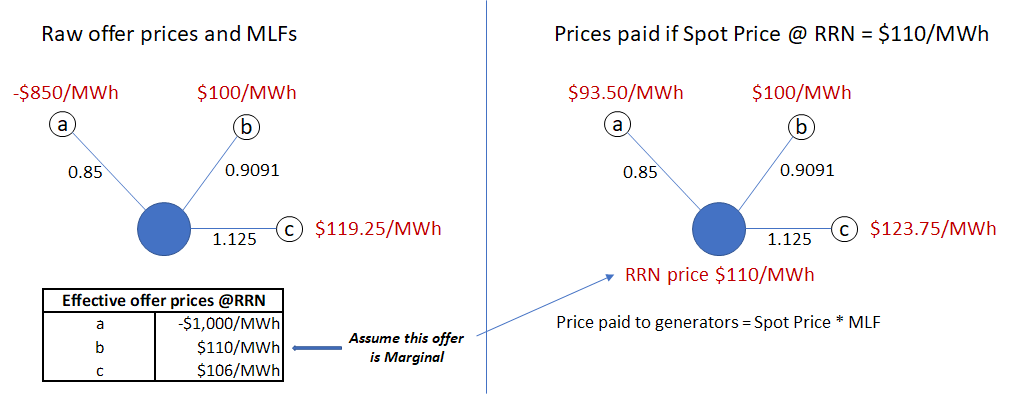
In dispatch, MLFs are treated as fixed, and are not used – as one might expect – to adjust offer volumes for losses; instead they are applied to “raw” offer prices (in principle a generator’s minimum price for delivering a megawatt-hour into the network at its physical location) to yield loss-adjusted effective offer prices at the Regional Reference Node.
For a generator in a location where power typically flows towards the RRN, offer prices are adjusted upwards (divided by an MLF which is less than 1 for such locations), to reflect power lost between the generator and the RRN. For a generator in a load-heavy region to which power normally flows from the RRN, offer prices are adjusted downwards (divided by an MLF greater than 1), since local generation reduces losses otherwise incurred in transmitting power to that location from the RRN.
In analysis and discussion of generator offers, we almost always refer to MLF-adjusted effective prices “at the RRN”, since these are directly comparable across generators and are the prices used to determine least-cost dispatch. A corollary of this treatment is that the actual location of demand and supply volumes within a region can be ignored in the dispatch process. All supply and demand volumes are treated (and measured) on a “generator terminal” basis as though those generators were at the common regional node, with the economic impact of losses accounted for in the effective offer prices. Finally, spot prices determined at the RRN are then multiplied by each generator’s MLF to yield the actual price paid to each generator for its energy. The following diagram provides an example of how this all works in practice:
nb This treatment is quite different to electricity markets like New Zealand’s which have a full “nodal pricing” model in which the transmission network, generator and demand locations, and losses are more fully represented in the dispatch process, yielding an explicit set of locational spot prices and network flows for every dispatch interval.
Inter-Regional Transfers and Losses
Between regions which have one or more direct transmission interconnections, inter-regional losses are treated very differently in the NEM dispatch process. It was recognised from the outset of the NEM design that flows between regions would be highly variable depending on supply demand balance and prices offered within each region, and that more dynamic treatment of flows, losses and price outcomes would be necessary to properly satisfy the least-cost objective for dispatch, and to optimise the value of power transfers between regions.
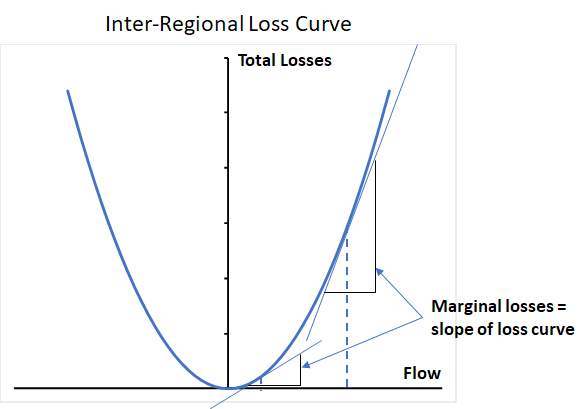
Without going into full detail, the dispatch process uses dynamic inter-regional loss factors across interconnections which vary with the level and direction of flows. As flows from one region to another increase, the incremental (marginal) losses in transferring an extra unit of power also increase. And if flows reverse, losses do not become negative and along with marginal losses again start increasing with the magnitude of flows. This is all summarised by a quadratic loss curve:
The NEM dispatch process uses these loss characteristics (with specific parameters for each interconnection) in seeking its least-cost solution. If the price of offers in one region allows power to be supplied into another region at lower overall cost than dispatching offers in the importing region, taking increasing marginal losses into account, then the exporting region offers will be preferentially dispatched, up to the point where either:
- demand in each region is fully satisfied by local generation +/- transfers,
- cheaper offers in the exporting region are exhausted,
- transfers increase just to the level where increasing marginal losses offset the exporting region’s price advantage, or
- physical network transfer limits are reached.
Following this logic allows the NEM dispatch process to find a combination of generation dispatch and inter-regional transfers across the entire NEM that achieves overall least cost for balancing supply and demand in each region.
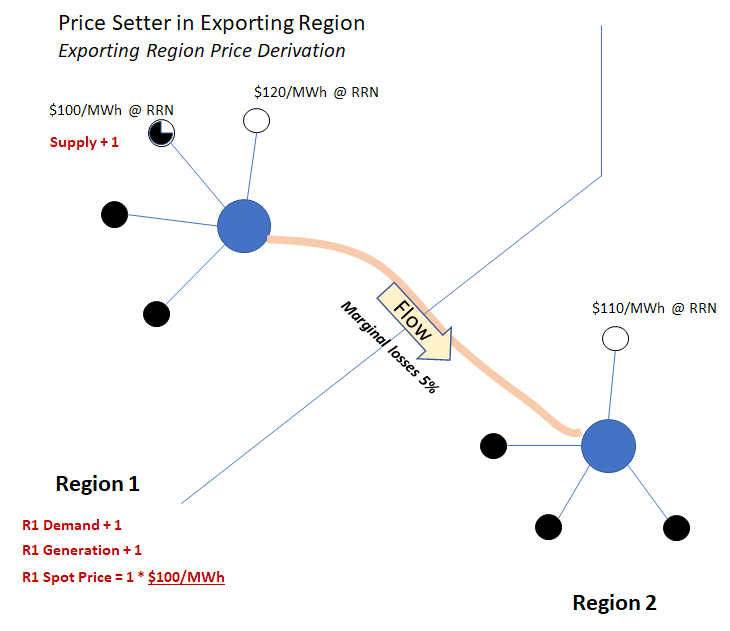
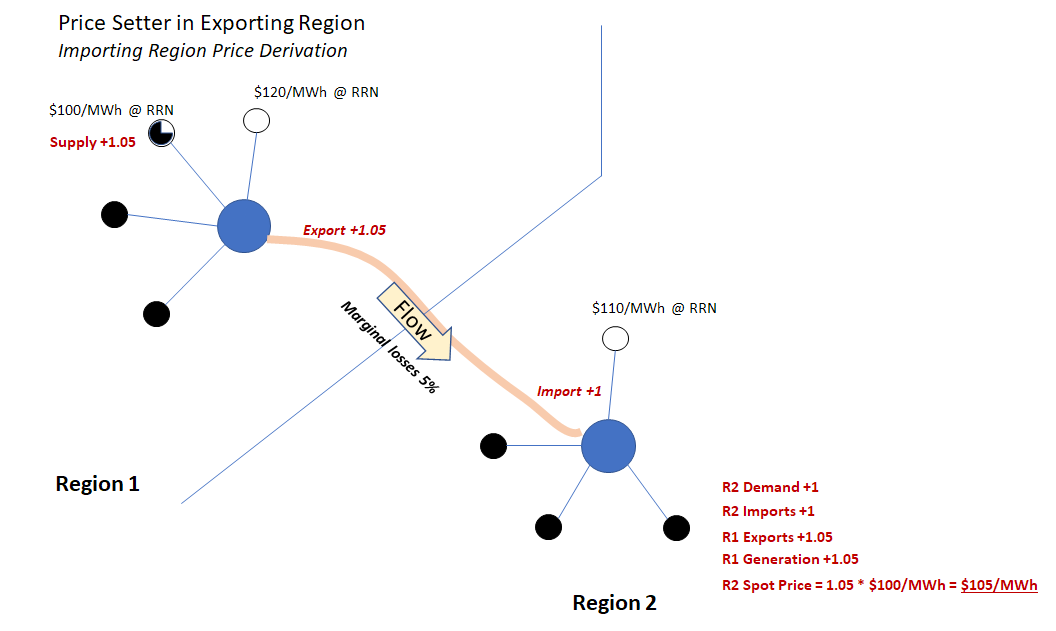
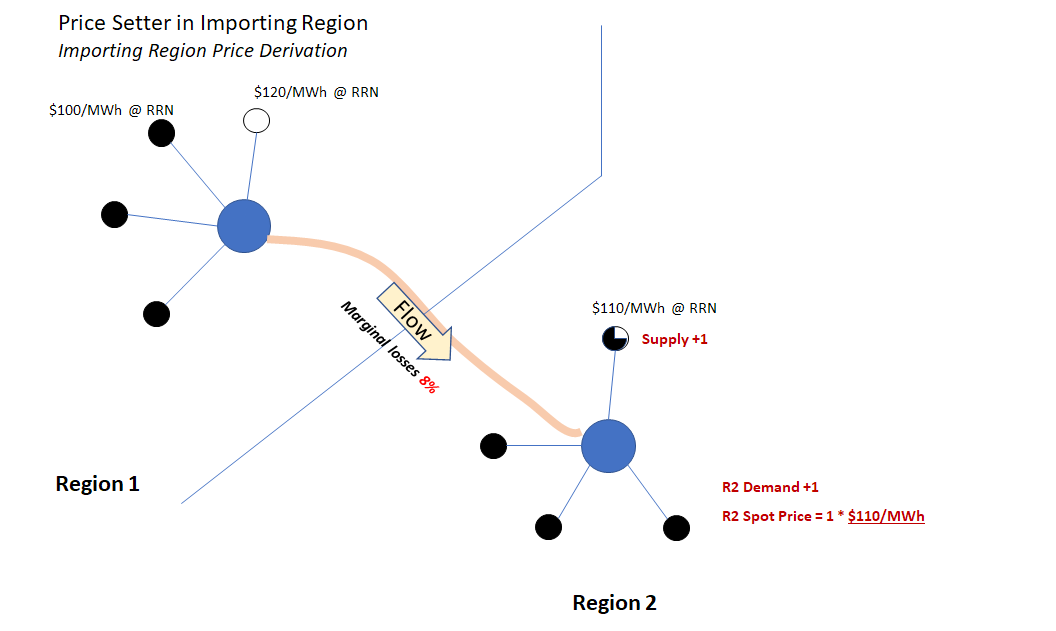
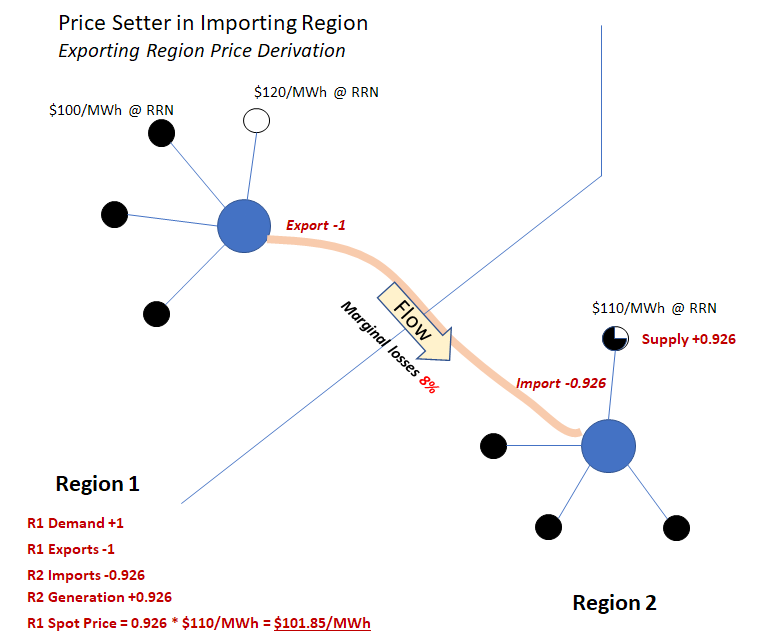
The resulting regional spot prices, and the relationships between them, can best be understood by referring back to the definition of each region’s spot price as the marginal cost of meeting additional demand in that region. The following charts take the relatively simple case of two interconnected regions, and step through the price formation process in both exporting and importing regions, starting from this basic definition of spot price.
In the first pair of charts, the lowest cost source of incremental supply for both regions (symbolised as a part-loaded generator) is located in the exporting region – you can think of this as corresponding to case 1) above:
In the second pair of charts – perhaps after demand in both regions has increased – the lowest cost available source is now located in the importing region – corresponding to case 2) above. Marginal interconnection losses are also higher:
A few important observations from these examples:
- In each case, a common generator offer determines the spot price in both regions
- Regardless of which region the price setter is in, the ratio between the importing region spot price and the exporting region spot price equals the marginal loss factor across the interconnection (if it’s not fully clear why, step through the calculation of spot prices for each region, which may involve adjusting interconnector flows and increasing generation in the other region to achieve least cost dispatch).
- For the assumed change of +1 in demand volume, the spot price can be expressed as a change in supply volume multiplied by an offer price; but the change in supply volume may differ from 1 – again because of losses.
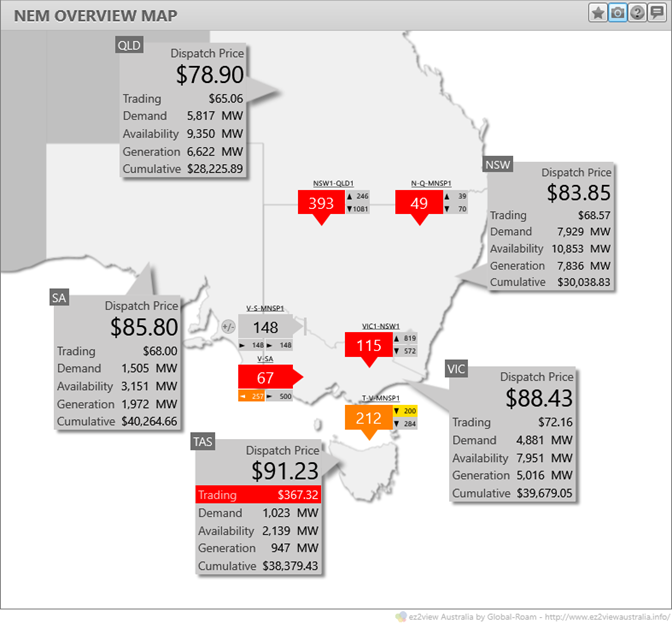
Understanding this process makes some real world AEMO price-setter data – at least in simple dispatch cases – easier to understand. Here’s an actual NEM dispatch interval, as seen in ez2view, where prices in all five NEM regions are being set by a single South Australian generator:
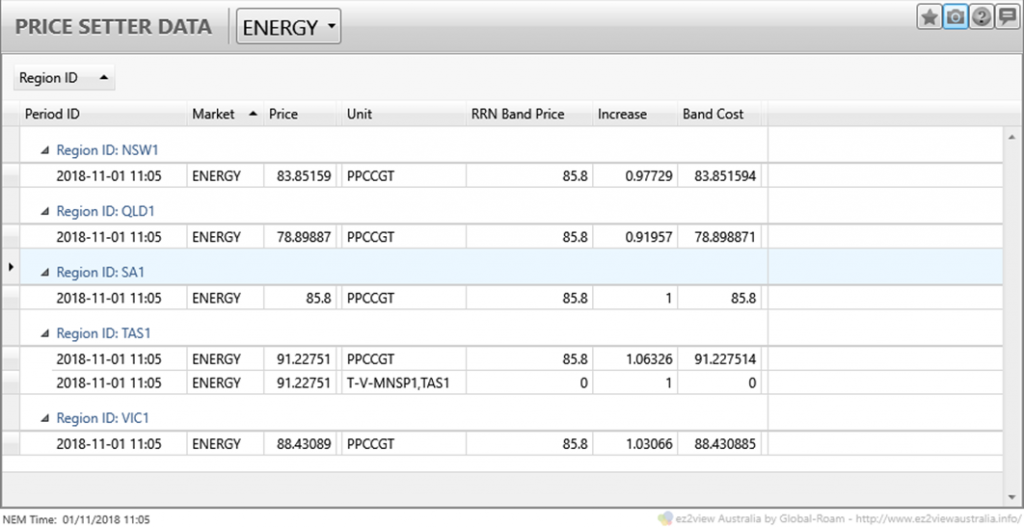
And here’s the corresponding AEMO Price Setter data showing that a single offer at $85.80/MWh from Pelican Point in South Australia (PPCCGT) was setting the energy price for all NEM regions at this time:
The “Increase” column shows the changes in dispatch volume for this offer required to satisfy a one megawatt demand change in each region respectively:
- a value of one for South Australia, being Pelican Point’s home region
- values greater than one for Victoria and Tasmania because those regions are each importing power from South Australia across the relevant interconnectors (in the case of Tasmania, the Increase reflects compounding of marginal losses across the SA-Vic and Vic-Tas interconnections)
- values less than one for NSW and Queensland because those regions are exporting towards Victoria. Meeting incremental demand of one megawatt in either of those regions involves reducing its exports by one megawatt and increasing Pelican Point generation by enough to offset the reduction in imports received in Victoria; as imports received in Victoria are significantly less than exports from either NSW or Qld due to losses, the net effect is that the reduction in imports can be covered by an increase in Pelican Point generation of less than 1, even after allowing for losses between SA and Victoria. You can check this at home if you like, by remembering that the ratio between adjoining regional spot prices equals the marginal loss factor for each interconnection, and working out the relevant volume changes region-by-region.
In each case you can also check that each regional spot price is Pelican Point’s offer price of $85.80/MWh multiplied by the relevant “Increase” value, the result of which is shown in the “Band Cost” column.
For anyone wondering about the “T-V-MNSP1,TAS1” entry for Tasmania – it’s technicality to do with the way Basslink is dispatched but in this case it makes no difference to the price outcome, so ignore it.
Constrained Interconnectors
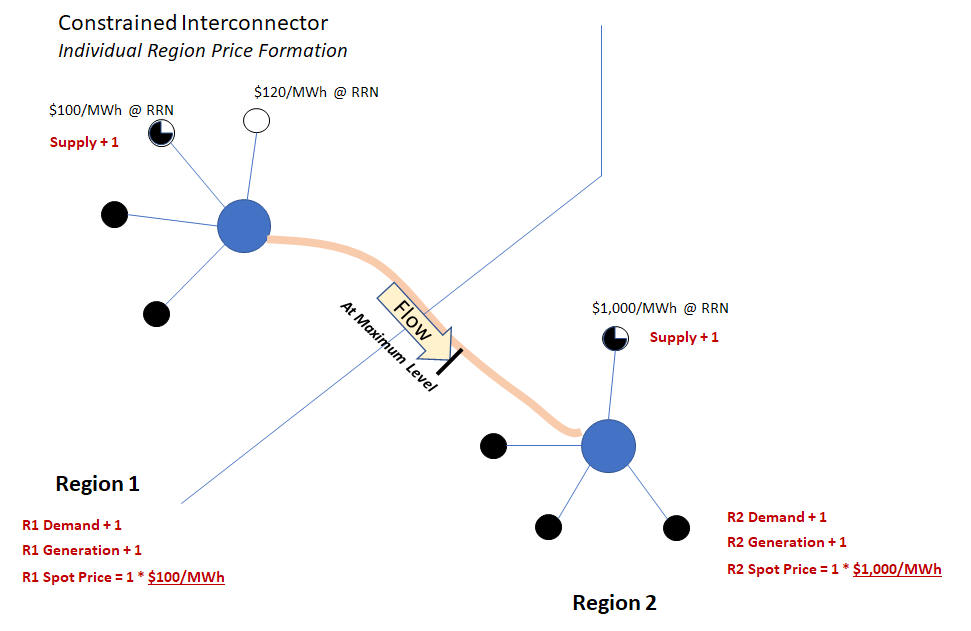
What happens in case 4) above where physical transfer limits across an interconnection are reached? This is usually pretty easy, since in this case each region reverts to having separate price setting offers:
Note that I’ve increased the price of the marginal offer in Region 2, just to emphasise than when an interconnection becomes constrained, price differences are no longer related to interconnector marginal loss factors.
A More Complex Case to Finish
I’d hoped to cover a little more in this instalment, but one final teaser to finish with.
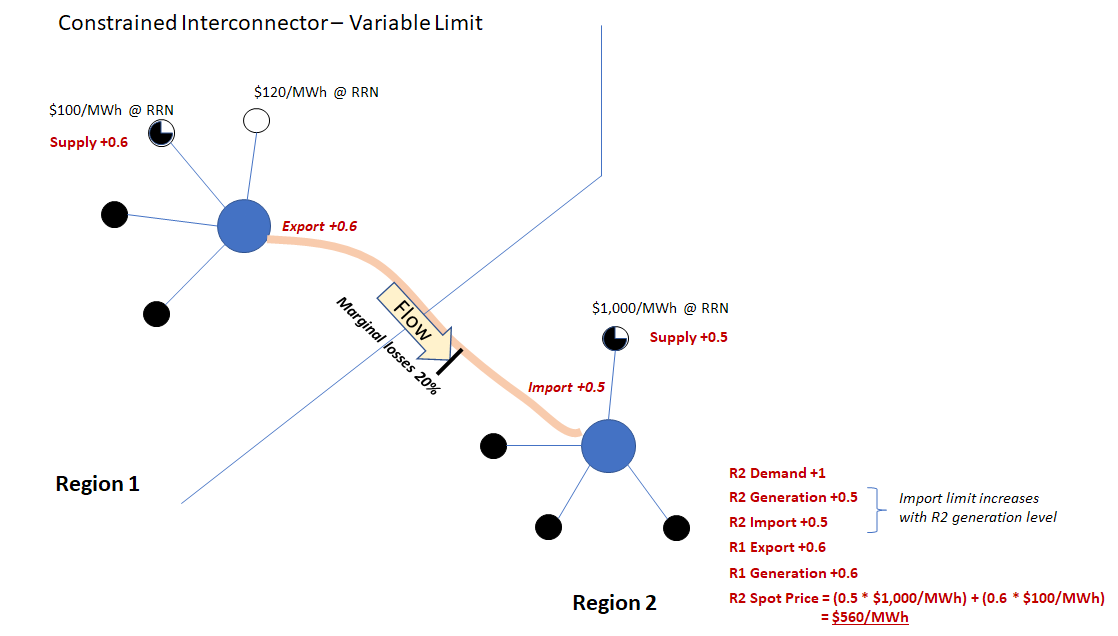
Let’s now assume that in the constrained interconnection case above, the limit on flow across that interconnection is not a fixed value, but varies depending on how some generators in one or other region are dispatched. This is actually the case for many important security and capacity limits on flows between NEM regions. For simplicity, let’s assume that increasing output from the marginal generator in Region 2 by one megawatt permits additional interconnection flow sufficient to deliver an extra one megawatt of import (after marginal losses) to Region 2. Finally let’s assume that at this flow level, marginal losses are 20% so that an additional 1.2 megawatts needs to be dispatched in Region 1 per megawatt received in Region 2.
Given these assumptions, here’s the marginal cost derivation for meeting an additional megawatt of demand in Region 2:
In this more complex case, the Region 2 spot price is now a “blend” of different offer prices, and meeting one extra megawatt of demand involves changes in offer dispatch at multiple generators in different regions which depend on both losses and also on the precise nature of the variable limit – or constraint – on interconnector flows. This is an example of “Category 3” in Paul’s taxonomy of price setter outcomes, and as Paul’s statistics showed, situations like this occur surprisingly often in the NEM.
——————————————-
About our Guest Author
 |
Allan O’Neil has worked in Australia’s wholesale energy markets since their creation in the mid-1990’s, in trading, risk management, forecasting and analytical roles with major NEM electricity and gas retail and generation companies.
He is now an independent energy markets consultant, working with clients on projects across a spectrum of wholesale, retail, electricity and gas issues. You can view Allan’s LinkedIn profile here. Allan will be sporadically reviewing market events here on WattClarity Allan has also begun providing an on-site educational service covering how spot prices are set in the NEM, and other important aspects of the physical electricity market – further details here. |


Dear me, all of this simply for the price of electricity. I really think we have lost touch with just how simple things can actually be.
I’ve been struggling for a while with the concept that all generators get paid the marginal price. Why don’t all generators receive the price they bid?
An alternate model would be “pay as bid” as noted here, Ben:
https://wattclarity.com.au/articles/2018/08/different-approaches-for-dispatch/
… but it’s important to realise that generators would bid differently in that case (i.e. to recover all their long run marginal cost, and make a return).
Thanks Paul, I agree that “pay as bid” may tend to increase some bids (and therefore wholesale prices), but if that’s the case, then would you say currently we do not have a market that prices cost of generation accurately?
A nodal model such as in New Zealand could lead to a better dispatch outcome for power stations near regional boundaries. For example the Murray Power station is in the Vic region but is penalised if sending power into NSW by a Victorian marginal loss factor of 0.9 (based on sending power to Melbourne), multiplied by the dynamic loss factor for export from Vic to NSW (which would be calculated from Melbourne to Sydney). Likewise the solar farms near Mildura are penalised by a Victorian marginal loss factor of 0.8, based on sending the power to Melbourne, multiplied by the dynamic loss factor of sending the power from Vic to SA (because Adelaide is the nearest major load centre). What are the downsides of a nodal model, and why wasn’t it used in the NEM?
The diagrams you show of the marginal loss factors are close to the physical layout of most States in the NEM as it was 20 years ago, before the near-border power stations were built, and Snowy had its own region. But has it come time to update it to a system that more closely approximates the physics?
Malcolm, market operators and designers have been grappling with the challenge of accounting for losses and constraints for as long as there have been electricity markets. It was Strategic Issue #2 internationally back in 1997 when I was involved with the Association of Power Exchanges, for instance:
https://wattclarity.com.au/articles/2011/05/6-enduring-challenges-for-competitive-electricity-markets/
There is a trade-off between engineering/physical specificity in locational pricing, and the ability of participants to effectively hedge risks that arise in the market (the current concerns about Marginal Loss Factors being just one manifestation of that trade-off).
With COAG Energy Council having requested the ESB to design “NEM 2.0” for a start date of 2025, I’m sure these 6 Strategic Issues from my APEx days in 1997 will be focus areas for consideration:
http://www.coagenergycouncil.gov.au/sites/prod.energycouncil/files/publications/documents/ESB%20-%20Post%202025%20Market%20Design%20-%20Scope%20and%20Forward%20Work%20Plan%20-%2020190322.docx.pdf
I will say again, the elephant in the room is roof top solar, and paying 100% for the export of that. As every day goes on and more and more is installed and more is exported and all still getting 100% of the export at the silly prices. The higher the cost to the system.
Someone needs to work out some kind of average loss of this stuff coming out of 240 (230volt) inverters and going back into the grid to be used, where???, and if its being used how much of it is able to be used. Keeping in mind that as more and more of it is going into the grid, the average distance its having to travel is further, on average.
Well unless its every second house in every street thats getting solar and on average its only haveing to go next door.
This is ideological nonsense based on neo-classical economic models. The simplest way to price electricity is to to take the average cost-plus a standard rate of return of return and retquire providers to supply on those terms on annual contracts. The facilities should be publicly owned. The idea that these are necessarily inefficient is just based on ideological observations by Hayek. The idea of letting providers opt out of supply is absurd for provision of a necessary social good. The idea of marginal cost determining price is absurd for a good where there are few providers. The “rent” for such a policy is claimed by private providers under NEM and with a high marginal cost for gas it means that provision is made at enormous system wide cost. My belief is that a courageous government needs to drop the ideological nonsense of neoliberalism and r
go back to public provision of socially necessary goods. Whatever the ‘inefficiencies” of this, they are nothing compared with the inefficiencies of having a small number of retailers, with each supporting a superstructure of trading administration supplying complexly different energy plans to the public.