As part of the process of compiling our Generator Report Card 2018, we’re taking a look at the instances where individual DUIDs were significantly Off-Target. In our longitudinal summary article today, we can’t see a clear trend emerging to suggest the overall aggregate absolute level of Off-Target is getting substantially worse, or better.
————-
One of the reasons why a generator might be Off-Target is that the participant might have disregarded the dispatch target.
(a) This is something that might happen at any Scheduled unit – and also any Semi-Scheduled unit (in periods where the Semi-Dispatch Cap flag was set).
(b) Remembering that it’s impossible to know a participants motivation, though it does not stop people (including us) guessing at what it might be, we wonder whether some of these times where targets have been missed might have been conscious choices for commercial reasons.
I already posted in September 2018 about the curly questions raised by what seems to be behaviour on 24th August at Lake Bonney 2 and Lake Bonney 3 Wind Farms (both Semi-Scheduled) that appears to be both:
(a) contrary to what the increase in output AEMO asked them to do for local system security reasons; and
(b) contrary to what the AER (or other participants) might have inferred from the bid that had been submitted to AEMO for that dispatch interval.
In our Generator Report Card 2018 we are keen to understand the pattern, and trend, of these sorts of behavioural challenges for the AEMO (who still need to keep the system stable even in the case of participants doing unexpected things for what seems to be commercial reasons).
Out of curiosity, our query for calendar 2018 revealed a number of other instances where output has gone the “wrong” direction, based on dispatch targets. In this post, I flag two separate examples and note that there were many more identified. I also want to flag that (to the extent possible in the time available before our Report Card is due) we want to investigate further to understand the specifics of what happened.
Example 1) Lake Bonney 2 Wind Farm on 7th July 2018
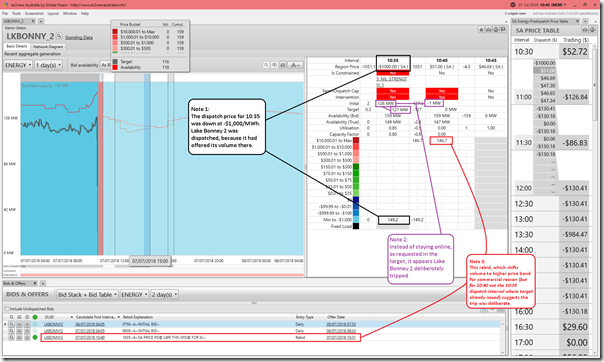
Here’s what seems to be a carbon copy of the same thing at Lake Bonney 2 Wind Farm in the 10:35 dispatch interval on 7th July 2018:
Again (as in this case posted earlier about events a little later in July), there was a rebid almost immediately afterwards that suggests the reason for what appears to be a trip in dispatch interval timeframe (but might have been a fast run back) was due to commercial reasons – i.e. avoidance of negative prices.
Example 2) Bungala 1 Solar Farm on 14th September 2018
In my first version of this article [updated 15th January 2019 based on further information], I flagged another instance where output had gone the opposite direction to the dispatch target at the same time the Semi-Dispatch Cap was set, and prices were negative.
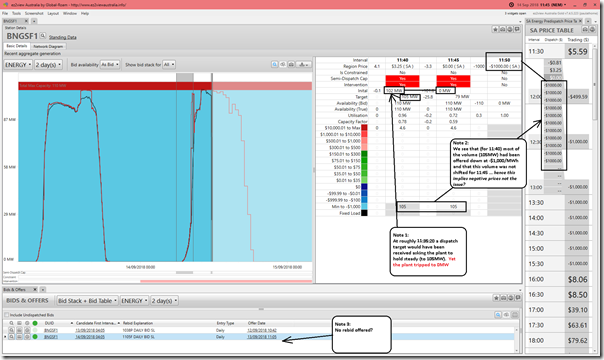
This happened in the 11:40 dispatch interval on 14th September 2018 where we see Bungala 1 Solar Farm “tripping” output from 102MW down to 0MW:
At 11:35:20 (roughly when the dispatch targets for 11:40 had been sent to Bungala asking them to remain steady at 102MW) the “Estimated Trading Price for the 12:00 half hour” had been down at –$666.26/MWh. However within 5 minutes, the solar farm output was down at 0MW – another unit OffTarget, but for unclear reasons.
I wondered whether this was another instance of the same sort of behaviour, though I had noted uncertainty because:
(a) There was no rebid.
(a1) A rebid might have indicated a shift in availability (as a result of some form of physical problem at the plant causing the trip).
(a2) Alternatively, it might have indicated change in allocation in capacity to avoid negative prices (as was the case for Lake Bonney 2).
(a3) However, the different bidding requirements that semi-scheduled plant operate under make it more difficult to know what actually triggered the drop in load to 0MW (though people associated with the operation of the plant have since clarified that it was physical in nature – hence a plain vanilla trip like these, which is understandable at this early stage of plant life – see other comments about “the bathtub curve“).
(b) We see the red line in the forecast section of the chart showing that ASEFS still thought the plant capable of outputting a fairly typical solar shape for the rest of the day
(b1) I noted on 7th January when posting this article that, at first glance it seems that ASEFS did not see any technical issues on the plant.
(b2) In the week since that time I have not had time to investigate further, and have had no specific information provided to me to help me understand the divergence between actual output and ASEFS forecast. Perhaps there is some form of lag between the units SCADA system and ASEFS that would mean that the forecast output was not revised downwards with the trip?
————-
Notwithstanding the complexities of trying to infer motivations from available data (and particularly the greater complexity in doing the same for Semi-Scheduled plant – due to lesser information publication) we will ponder this further in the process of preparing our Generator Report Card.


Leave a comment