Over the 10 years that WattClarity has been running, we’ve seen a number of coal-fired power stations close – some of these closures being documented in other articles in WattClarity, as noted in the table below:
| DATE | REGION | STATION | COMMENTS |
| May 2016 | SA | Northern | Closure of Northern was flagged in June 2015, but did not close for another 11 months – on 9th May 2016. |
| Aug 2015 | VIC | Anglesea | Anglesea closed in mid 2015 in conjunction with the closure of the Point Henry aluminium smelter. |
| Sept 2014 | VIC | Morwell | The small Morwell (Energy Brix) plant closed during September 2014. |
| July 2014 | NSW | Redbank | Redbank (a single unit station) began an outage at the end of July – however in November 2014 it was announced that the station would not return from outage.
Hence Notice Period was essentially NIL. |
| March 2014 | NSW | Wallerawang | In this article of September 2013, we noted a change in AEMO’s PASA projection and speculated that it might be due to impending Wallerawang closure. |
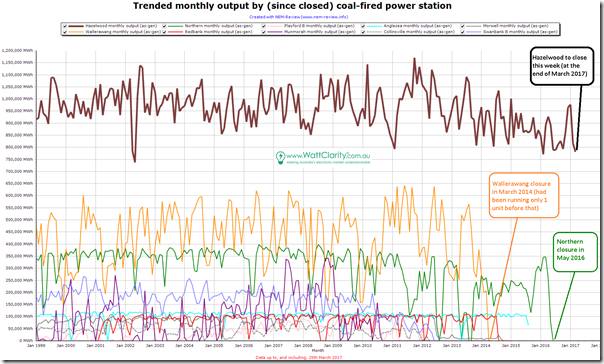
The scale of these (and other) closures is seen in the following chart from NEM-Review v6, which charts the monthly total production from a selection of the coal plant which have closed over the years:
As can be clearly seen, Hazelwood is easily the largest of these stations – and it also happens to be close to the top, in terms of emissions intensity of those in this listing (and certainly the most emissions intensive of the stations still operating in the NEM):
With the possible exception of the Northern Power Station in South Australia, none of the above seem to have attracted such vehement opposition from the large and vocal group of people keen to see the station closed in order to improve the emissions intensity of the electricity sector.
As such, I thought it might be worth documenting the demise of Hazelwood on this post on WattClarity …
(A) Leading up to this week…
The decision to close Hazelwood was announced on 3 November 2016 and hence reflected as a big step change in MT PASA. This announcement was only 4 short months ago – a short notice period that has attracted the ire of some participants, and which will be the subject of further commentary on WattClarity at another time.
Leading up to this announcement, there was much speculation that it was coming down the pipeline – and, included in the speculation, all sorts of prognoses about how the closure would affect electricity prices (wholesale and retail, in Victoria and elsewhere). Hence on 2nd November 2016 I posted these cautions for those being too sure of exactly what would eventuate – which could be summed up by noting that “forecasting is a mug’s game” .
Earlier than that, I posted these comments on 26th September 2016 about how the station output and spot revenue had trended over time.
On 14th March 2017, I posted these comments about how futures pricing was ramping up in Victoria prior to the closure of the Hazelwood plant.
(B) Through the week
As we walked through the week, it was with with a slightly unsettling fascination that we watched all 8 units turn off (with associated communications on social media), as follows:
(B1) Sunday 26th March 2017
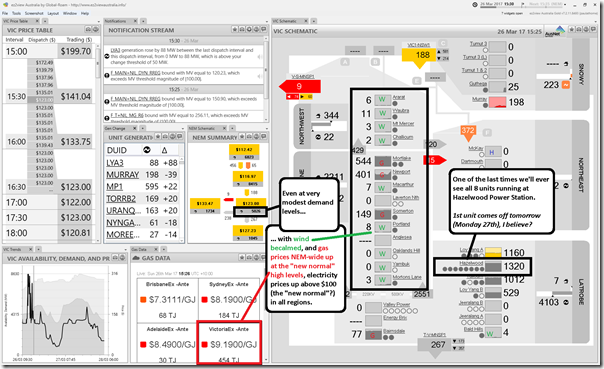
On Sunday afternoon, this snapshot from ez2view (focused on the Victorian region) has recorded one of the last times we’ll see all 8 units at Hazelwood Power Station running.
Despite the inputs from the 15 units across 4 stations, we see electricity prices up above $100/MWh in this snapshot from 15:30 NEM time (so 16:30 Melbourne daylight savings time) despite the fact that it’s only modest demand levels across the NEM.
As noted a number of times on WattClarity before, occasions like this highlight the diabolical challenges facing the electricity supply sector in the coming 10-20 years (and especially for endangered energy-intensive industrial facilities given coincident structural challenges for all of the fuel types highlighted here:
1) Starting with coal-fired generation, which is in structural decline due to the externalities of climate change (and flow-on effects);
2) We see gas-fired generation bidding significantly higher than it would have in yester-year, by virtue of the export parity pricing that is now commonplace and national;
3) We see wind generation going missing again, illustrating the challenge of the not nearly enough diversity that our approach to this energy transition has delivered, to date;
4) Not shown on this image, but a factor in every afternoon period, is the decline in solar output through the afternoon (discussed before here);
5) We also see minimal output from hydro facilities – which themselves experienced systemic shortages in the drought of 2007 (more locally in Tasmania in 2015), and will so again in the future.
Perhaps next week I will have time to post some thoughts on “root causes” of this energy crisis?
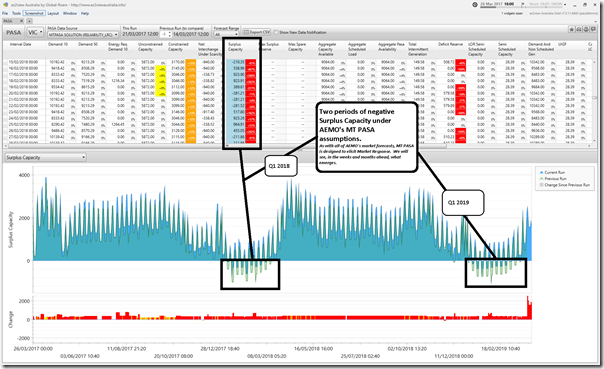
I’ve also included a snapshot of last Tuesday’s MT PASA run (from 21st March) showing the 2 periods (Q1 2018 and Q1 2019) where Surplus Capacity is forecast to be negative in Victoria with the loss of the capacity of Hazelwood:
As noted on the image, AEMO’s forecasting processes (including the MT PASA) are intended to elicit a market response.
Hence this should not be read to imply that the lights are going to go out – however it can be taken as a leading indicator that the supply/demand balance will be tighter than (compared to other times) and hence it’s likely that prices will be higher. It’s also an open question about what type of market response will eventuate, given the root causes of the energy crisis that has arrived has also meant that the investability of new supply options that would ameliorate this deficit is more challenged than would ideally be the case.
Late on Sunday, Lucille Keen posted this article at AFR noting the closures would be sequenced, with 3 units closed on Monday, another 3 units on Tuesday and the final 2 units on Wednesday.
(B2) Monday 27th March 2017
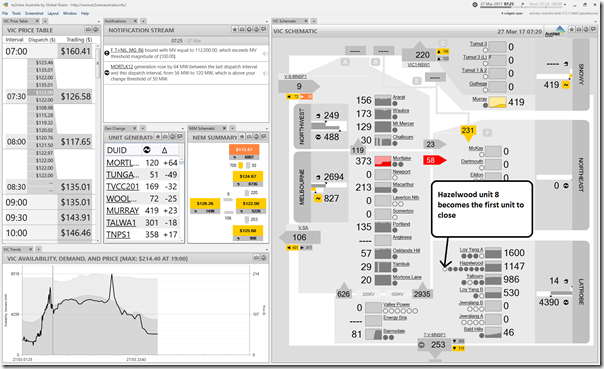
Early Monday morning (07:25 NEM time) we noted that unit 8 had already tapered off and closed overnight – as shown in this image from ez2view:
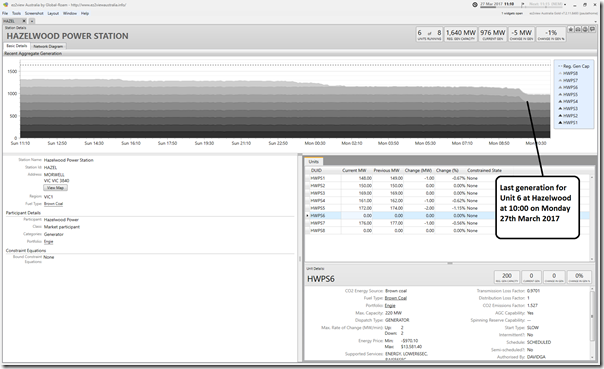
Unit 6 came offline a little later in the morning:
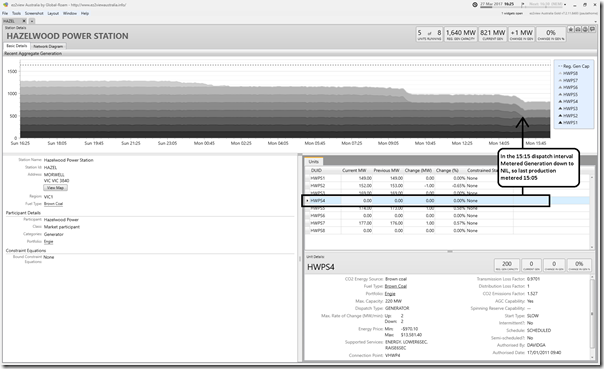
The third unit down was Unit 4, which showed last production metered at 15:05 NEM time as shown in this Station Details widget within ez2view:
(B3) Tuesday 28th March 2017
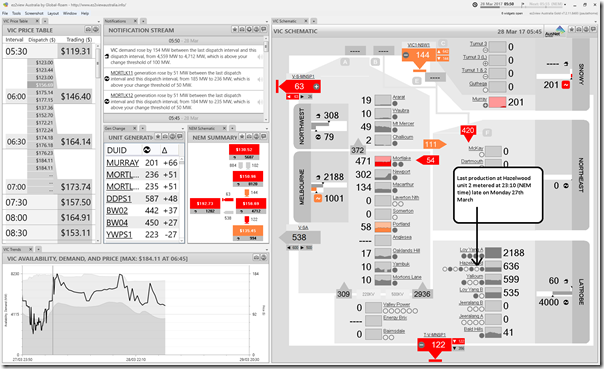
Early on Tuesday morning (05:50 NEM time) we see that we’re now down to only 4 units remaining – with Unit 2 having come offline overnight:
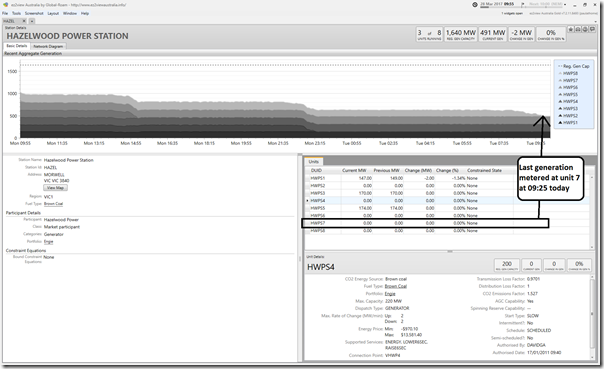
As shown in the ez2view snapshot below, last generation metered at unit 7 at 09:25 NEM time on Tuesday:
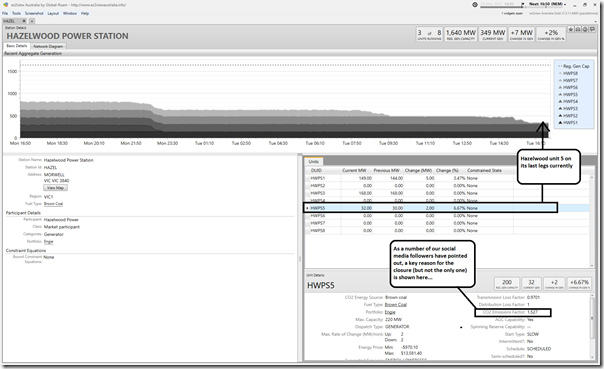
Late on Tuesday afternoon, we noted last legs for unit 5:
(B4) Wednesday 29th March 2017
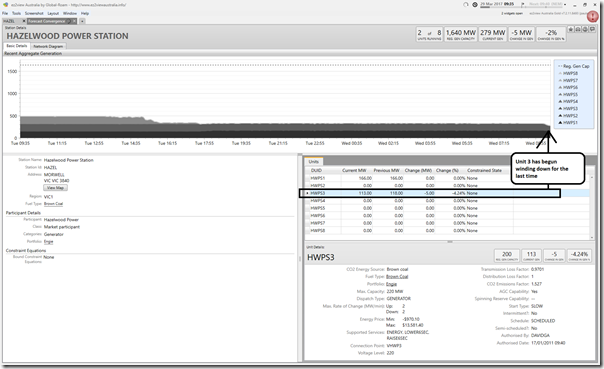
I was a little surprised to see, this morning, the remaining 2 units still running – but (at 09:15) saw Unit 3 begin winding down for the last time:
Also on Wednesday I noted this article by Dylan McConnell speaking about some implications of Hazelwood closure, including the “will the lights stay on” question.
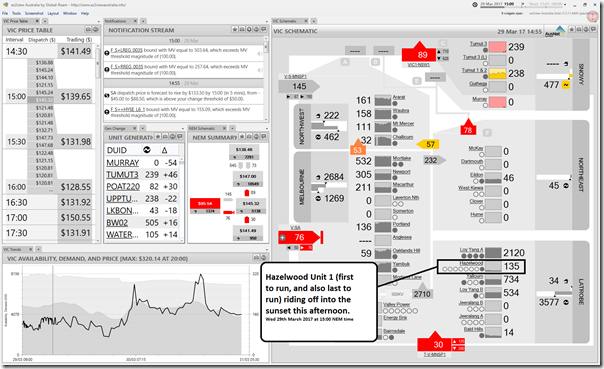
This left Unit 1 as the last unit to close – which started winding down in the early afternoon:
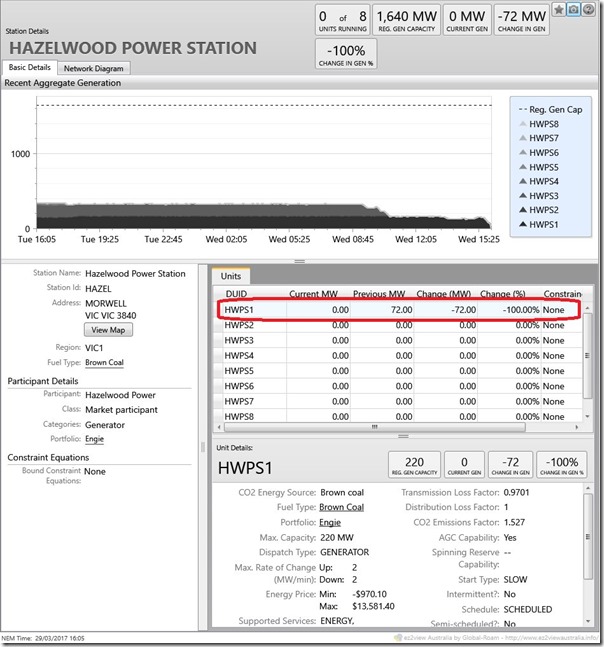
One of our guest authors on WattClarity (Allan O’Neil) sent me this image via social media capturing the Dispatch Interval (16:05) in which output from unit 1 dropped to zero:
That’s lights out for Hazelwood… (as distinct from the broader, and way-too-politicised question about the broader Victorian region, or the whole NEM).
(C) Some lessons that might be learnt
In my opinion, the whole sorry saga of Hazelwood closure would offer a number of valuable lessons that we could, collectively, deploy to smooth a few bumps out of this multi-faceted energy transition.
In an ideal world, I’d be confident that the relevant parties would learn from this example – however my jaundiced view is that we’re in such a polarised state (pulled by irrational extremes at both ends of the Emotion-o-Meter that this is unlikely to happen). Sad, really, given the importance.
I don’t have time today to go into any detail, but would just flag these points as areas for future exploration on WattClarity when more time is available:
(C1) Clarifying economic incentives for new build, and closure of old
Firstly we have the whole sad tale of confused, changing and contradictory economic faced by Hazelwood (and indeed all power stations in the NEM – existing and prospective) that, evidence would suggest, is delivering perverse outcomes if the objective is indeed to deliver on all three aspects of “the energy trilemma” – security of supply, cost, and ecological sustainability.
These economic incentives need to provide the right signals for both:
1) Building new capacity to supply electricity when and where it is needed.
2) Closing old, emissions-intensive capacity in the most logical sequence cognisant of system security, electricity price and emissions reduction objectives.
Wishful thinking, me, for such an idealised world. Instead we have a dog’s breakfast – and have had for 10 years or so. It’s my understanding that some of the factors leading to the closure decision were referenced in my “clapped out second car” analogy a couple of years back.
(C2) Working with those affected
Despite the fact that the closure of Hazelwood (and Northern before it, and so on) has been telegraphed well in advance, even if the exact date has not been known, my sense is that we’ve been a little on the back foot in terms of assistance to those workers, contractors, suppliers and others affected by such a change.
(C3) Looking ahead
I have noted before that forecasting is a mugs game – though I understand that it is a very important role that some must play.
It’s important also to note that the NEM is a market, hence participants respond to signals (albeit in great confusion at present with the muddled mess of policy we have).
Couple the two together and it’s clear to me that anyone making pronouncements with extreme certainty will almost certainly end up being wrong. A key question for me, with respect to these prophets is:
1) whether they don’t understand the limitations of their view (i.e. their competence) or
2) whether they do, but talk with certainty anyway (i.e. their motivation).
Which leads to the two big questions being asked:
(C3a) Will the lights stay on?
In truth the answer is “it depends…”
It depends on how hot next summer is (and hence how high demand is). It depends on whether we experience coincident problems with generators or transmission (low probability, but it has happened in the past). It depends on what participants do with their existing capacity. It depends on what new capacity might come online before then (albeit with the limitations of wind and solar for providing firm capacity on demand). It depends on how much storage is deployed over the year, and how this is incentivised to operate.
Food for another post at some stage in future.
(C3b) Will prices rise?
I’ve already noted before the difficulties in understanding how prices might actually turn out for some point in the future. Given we’re now sitting at the end of March (with summer behind us, and Hazelwood closed) the next “high risk” period will be Q1 2018.
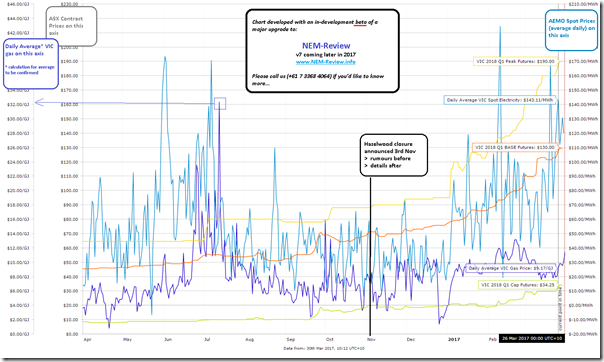
Hence it might be useful to consider the following chart (generated with an in-development copy of NEM-Review v7 (existing v6 clients already have early access to a BETA)) which shows the trended prices for BASE, PEAK and CAP contracts for Q1 2018 in Victoria:
It seems clear from this that “the market” (collectively) is thinking that prices are going up.
Now to be clear the uplift is not all due to the Hazelwood closure (as others have noted, strengthening gas prices have also played a role – so I have also included them on the chart, though note we still have to confirm logic for calculation of an average VIC gas price for a day, given the different “gas day”).
Stay tuned for more…


Thanks for the analysis Paul. This transition really does feel chaotic and would be nice if some level of government could decide what they were doing and plan into the future just to give us some indication of future employment, if nothing else!
We are already seeing some announcements that would partially offset the loss of Hazelwood, such as the additional unit at Pelican Point and large solar in SA (Bungala 200 MW, Riverland 330 MW, Kingfisher 120 MW, Tailem Bend ~100 MW) and northern Victoria (Mildura area 320 MW, Gannawarra 60 MW).
South Australia has tended to be an energy importer from Victoria, but would likely turn to being a net exporter on account of its better solar resource, and Pelican Point being the most efficient gas-fired power station in SA/Vic. It has among Australia’s best solar resource in locations close to areas of grid strength. This would help balance out wind, because days of low wind usually have good sun.
Should also note that while Hazelwood closed, there were 3 large coal units at Loy Yang A and Yallourn. When these are returned to service there would be an additional 1220 MW of coal capacity.
“days of low wind usually have good sun” would appear to be a remarkably liberal use of the word ‘usually’. http://www.sciencedirect.com/science/article/pii/S0960148115303591 https://bravenewclimate.com/2015/11/08/the-capacity-factor-of-wind/
The use of the word transition to me infers an ordered change of state. Instead we have a bunch of fairly random decisions taken on the basis of ideology, politics and virtue signalling.
It seems absent any thoughtful and informed work on a forward plan and the right mix and sequencing of power sources. Right up to this day, I have seem nothing that looks like anyone has any kind of plan beyond what they need to do for the next State or Federal election cycle.
I am in VIC and will be installing what I need to protect myself over the winter period. Probably a reasonably sized generator and transfer switching.