The following image (from NEM-Watch v8) clearly illustrates how temperatures in the southern half of QLD climbed significantly over the day, compared to the rest of the NEM.
As a result of these temperatures, QLD’s demand has climbed through the day to be currently just above 8,000MW.
Whilst still 800MW or so away from the all-time maximum, it is a significant level of demand – considering that it’s New Year’s Eve and so there’s considerable commercial/industrial demand “on holidays”.
The high level of demand is indicated above by the yellow-ish colour of QLD in the display (in NEM-Watch v8, demand is set on a sliding scale between blue (lowest demand in recent years) and red (peak demand)).
However, note that the demand in the rest of the NEM (because of more moderate temperatures, and indeed cool temperatures (for summer) in Tasmania. As such, NEM-wide demand at the moment is only 25,530MW, as highlighted on the above image (i.e. not going to make the record for peak NEM demand this summer!)
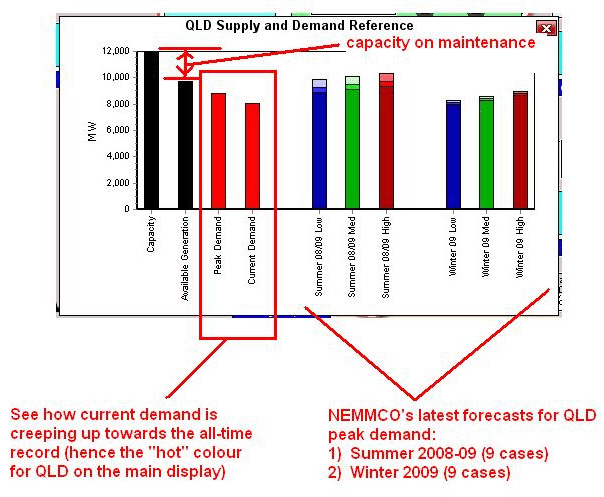
By clicking the supply-demand reference button (highlighted on the above image) you are able to see the QLD situation in more detail, as the following chart pops up in front of the main display:

Through this chart, you will be able to gain insight into:
- How the current demand compares against the historical peak demand for the region;
- How the current demand compares against NEMMCO’s latest forecasts for the peak demand the next summer and winter; and
- How much plant is out on maintenance currently (or otherwise unavailable) compared with the installed capacity (as noted in the latest SOO (Statement of Opportunities)).


Be the first to comment on "A hot day in QLD today!"