
In a sign of the times (and perhaps the future), today we’ve seen the largest intra-day price spread for a region in NEM history — with $21,019.65 separating the highest and lowest priced dispatch intervals in NSW.
As we’ve already reported, the NSW spot price hit the Market Price Cap (MPC) during the 12:20 dispatch interval, reaching $20,300/MWh in a short-lived but sharp spike that wasn’t forecast in P5 pre-dispatch.
In our earlier article, linked above, we highlighted some of the dynamics at play in the region (including three interesting constraint equations), and mentioned that the AEMO’s P5 model was projecting another price spike later in the afternoon. At the time of writing, further high prices have yet to eventuate, with prices instead heading the opposite direction.
Around three and half hours after that earlier price spike, at the 15:45 dispatch interval this afternoon the pendulum swung completely the other way, with the NSW price dropping to –$719.65/MWh, just a few hundred dollars short of the market floor (set at -$1,000/MWh).
Below are the two snapshots captured in ez2view’s NEM Map Widget, illustrating the high and low point for prices in NSW today.
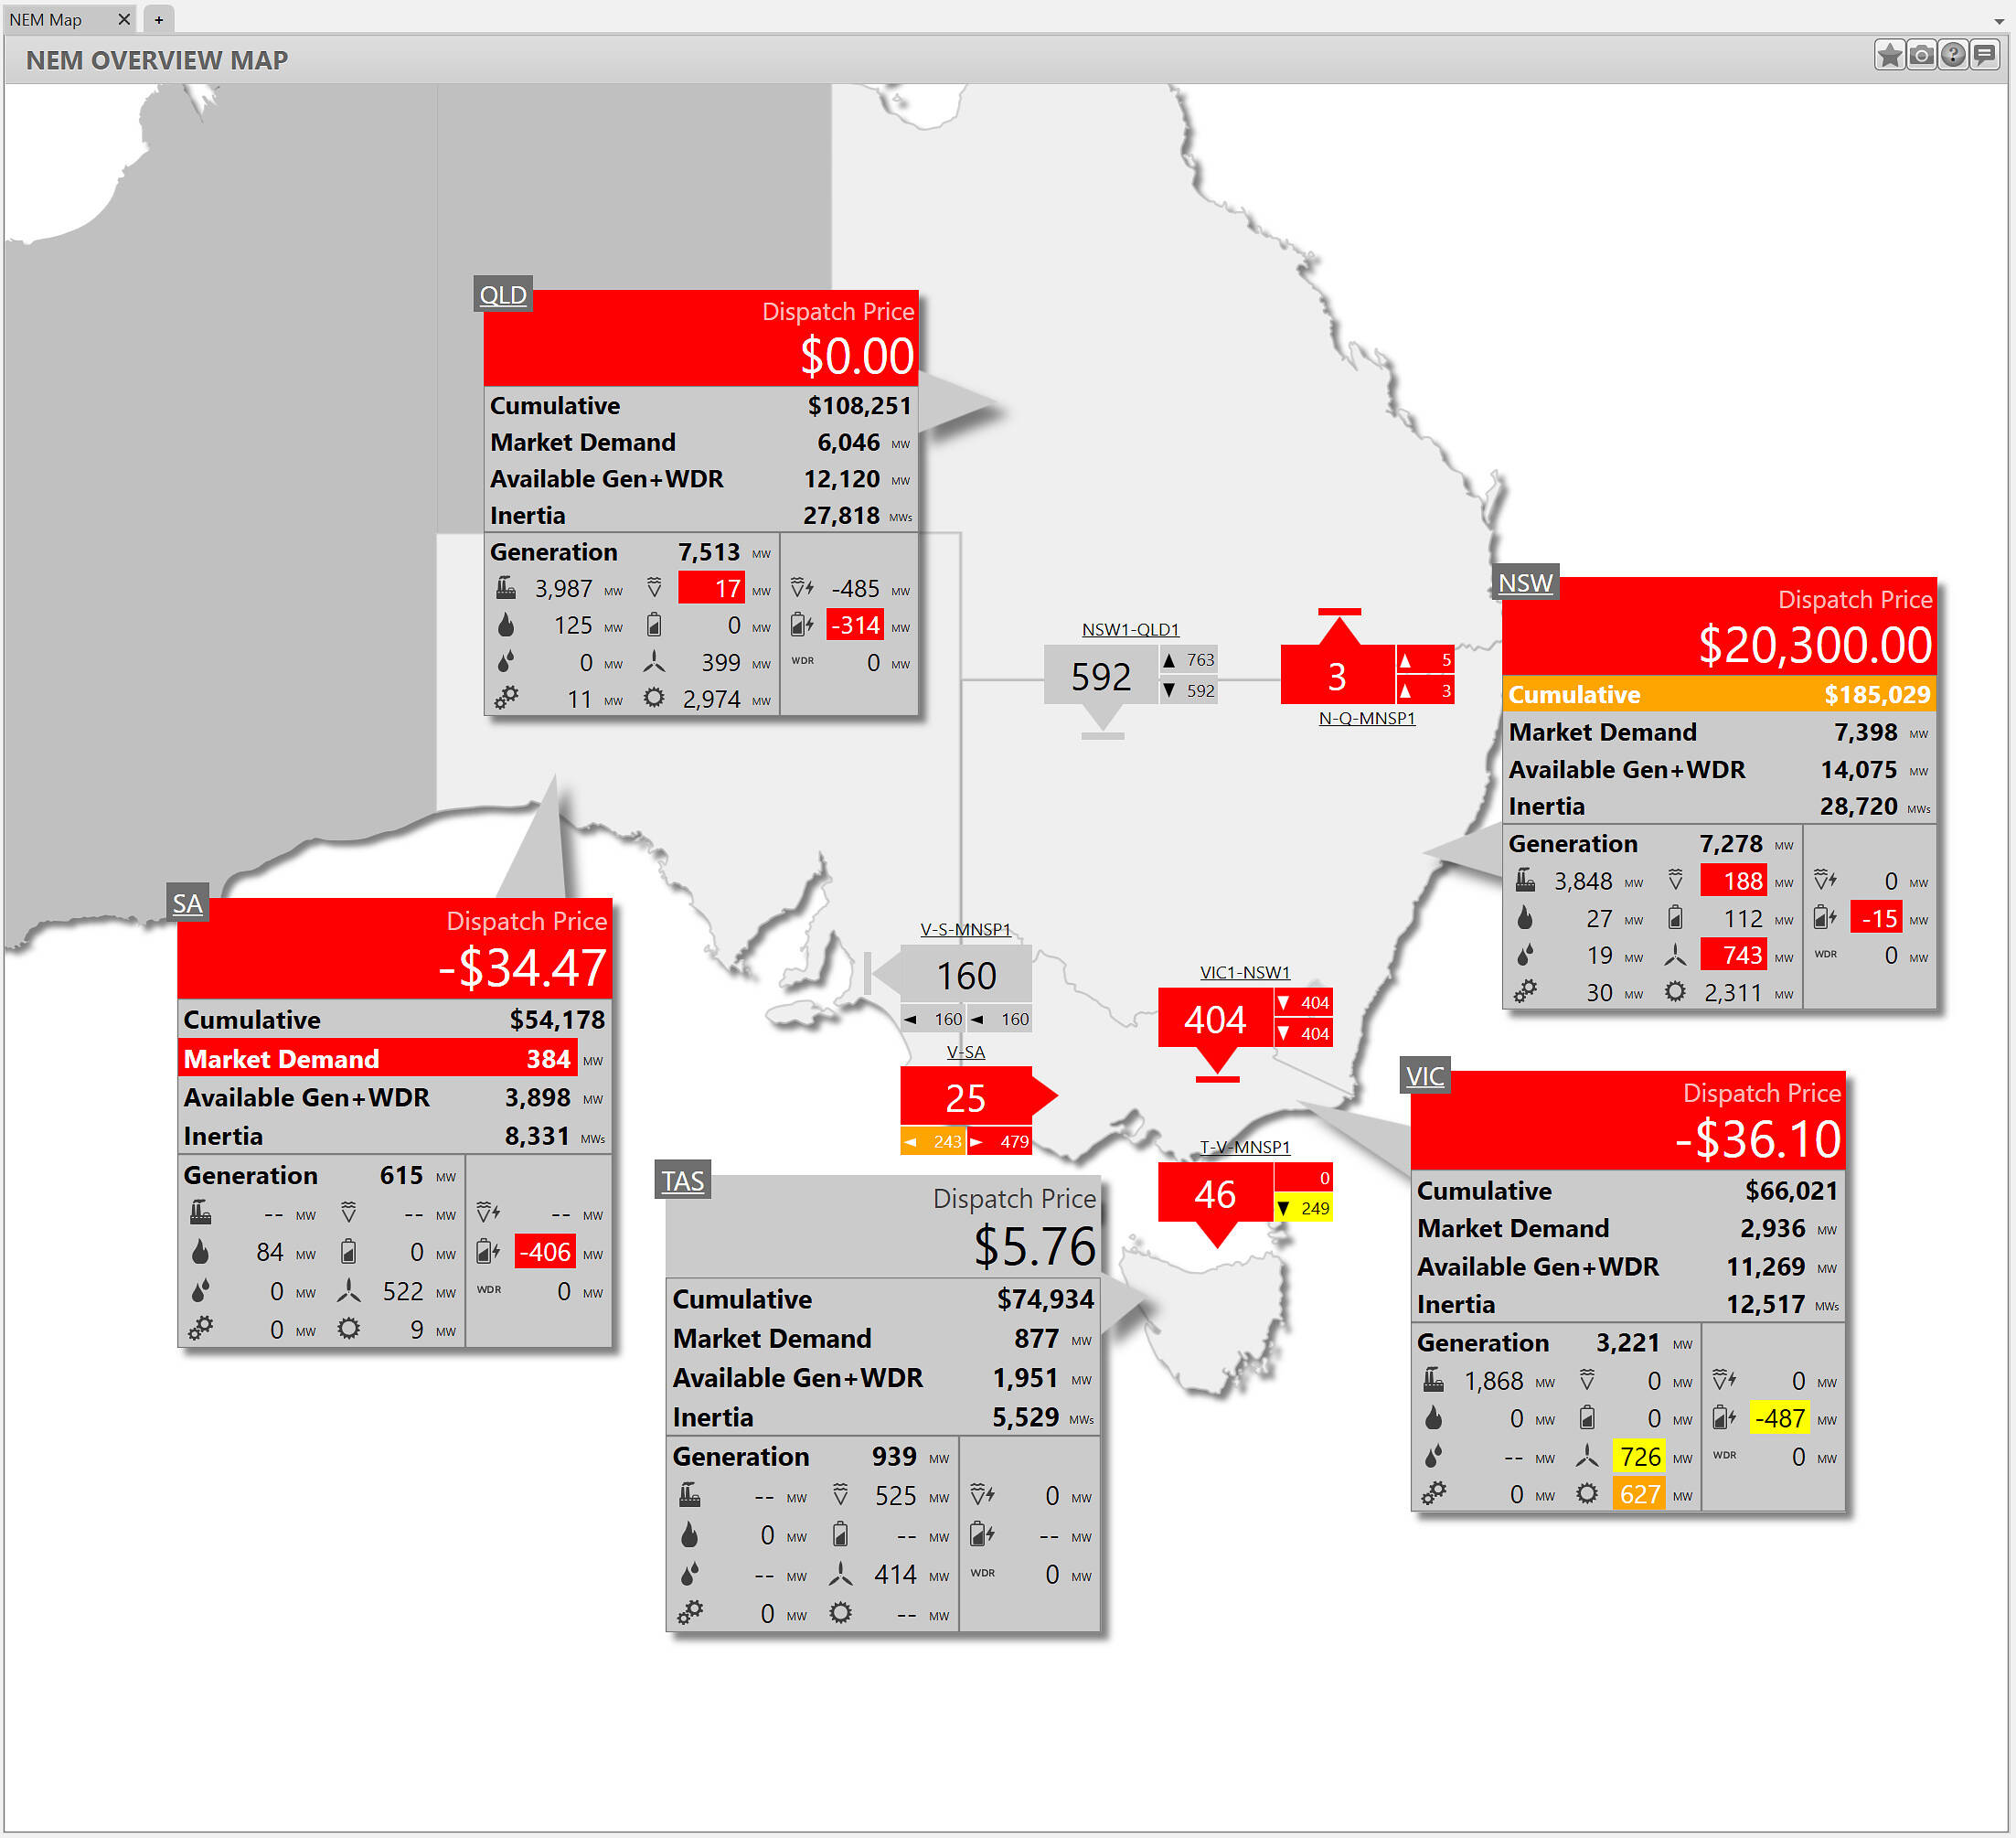
Source: ez2view’s NEM Map Widget. Screenshot taken at 12:20pm NEM time.
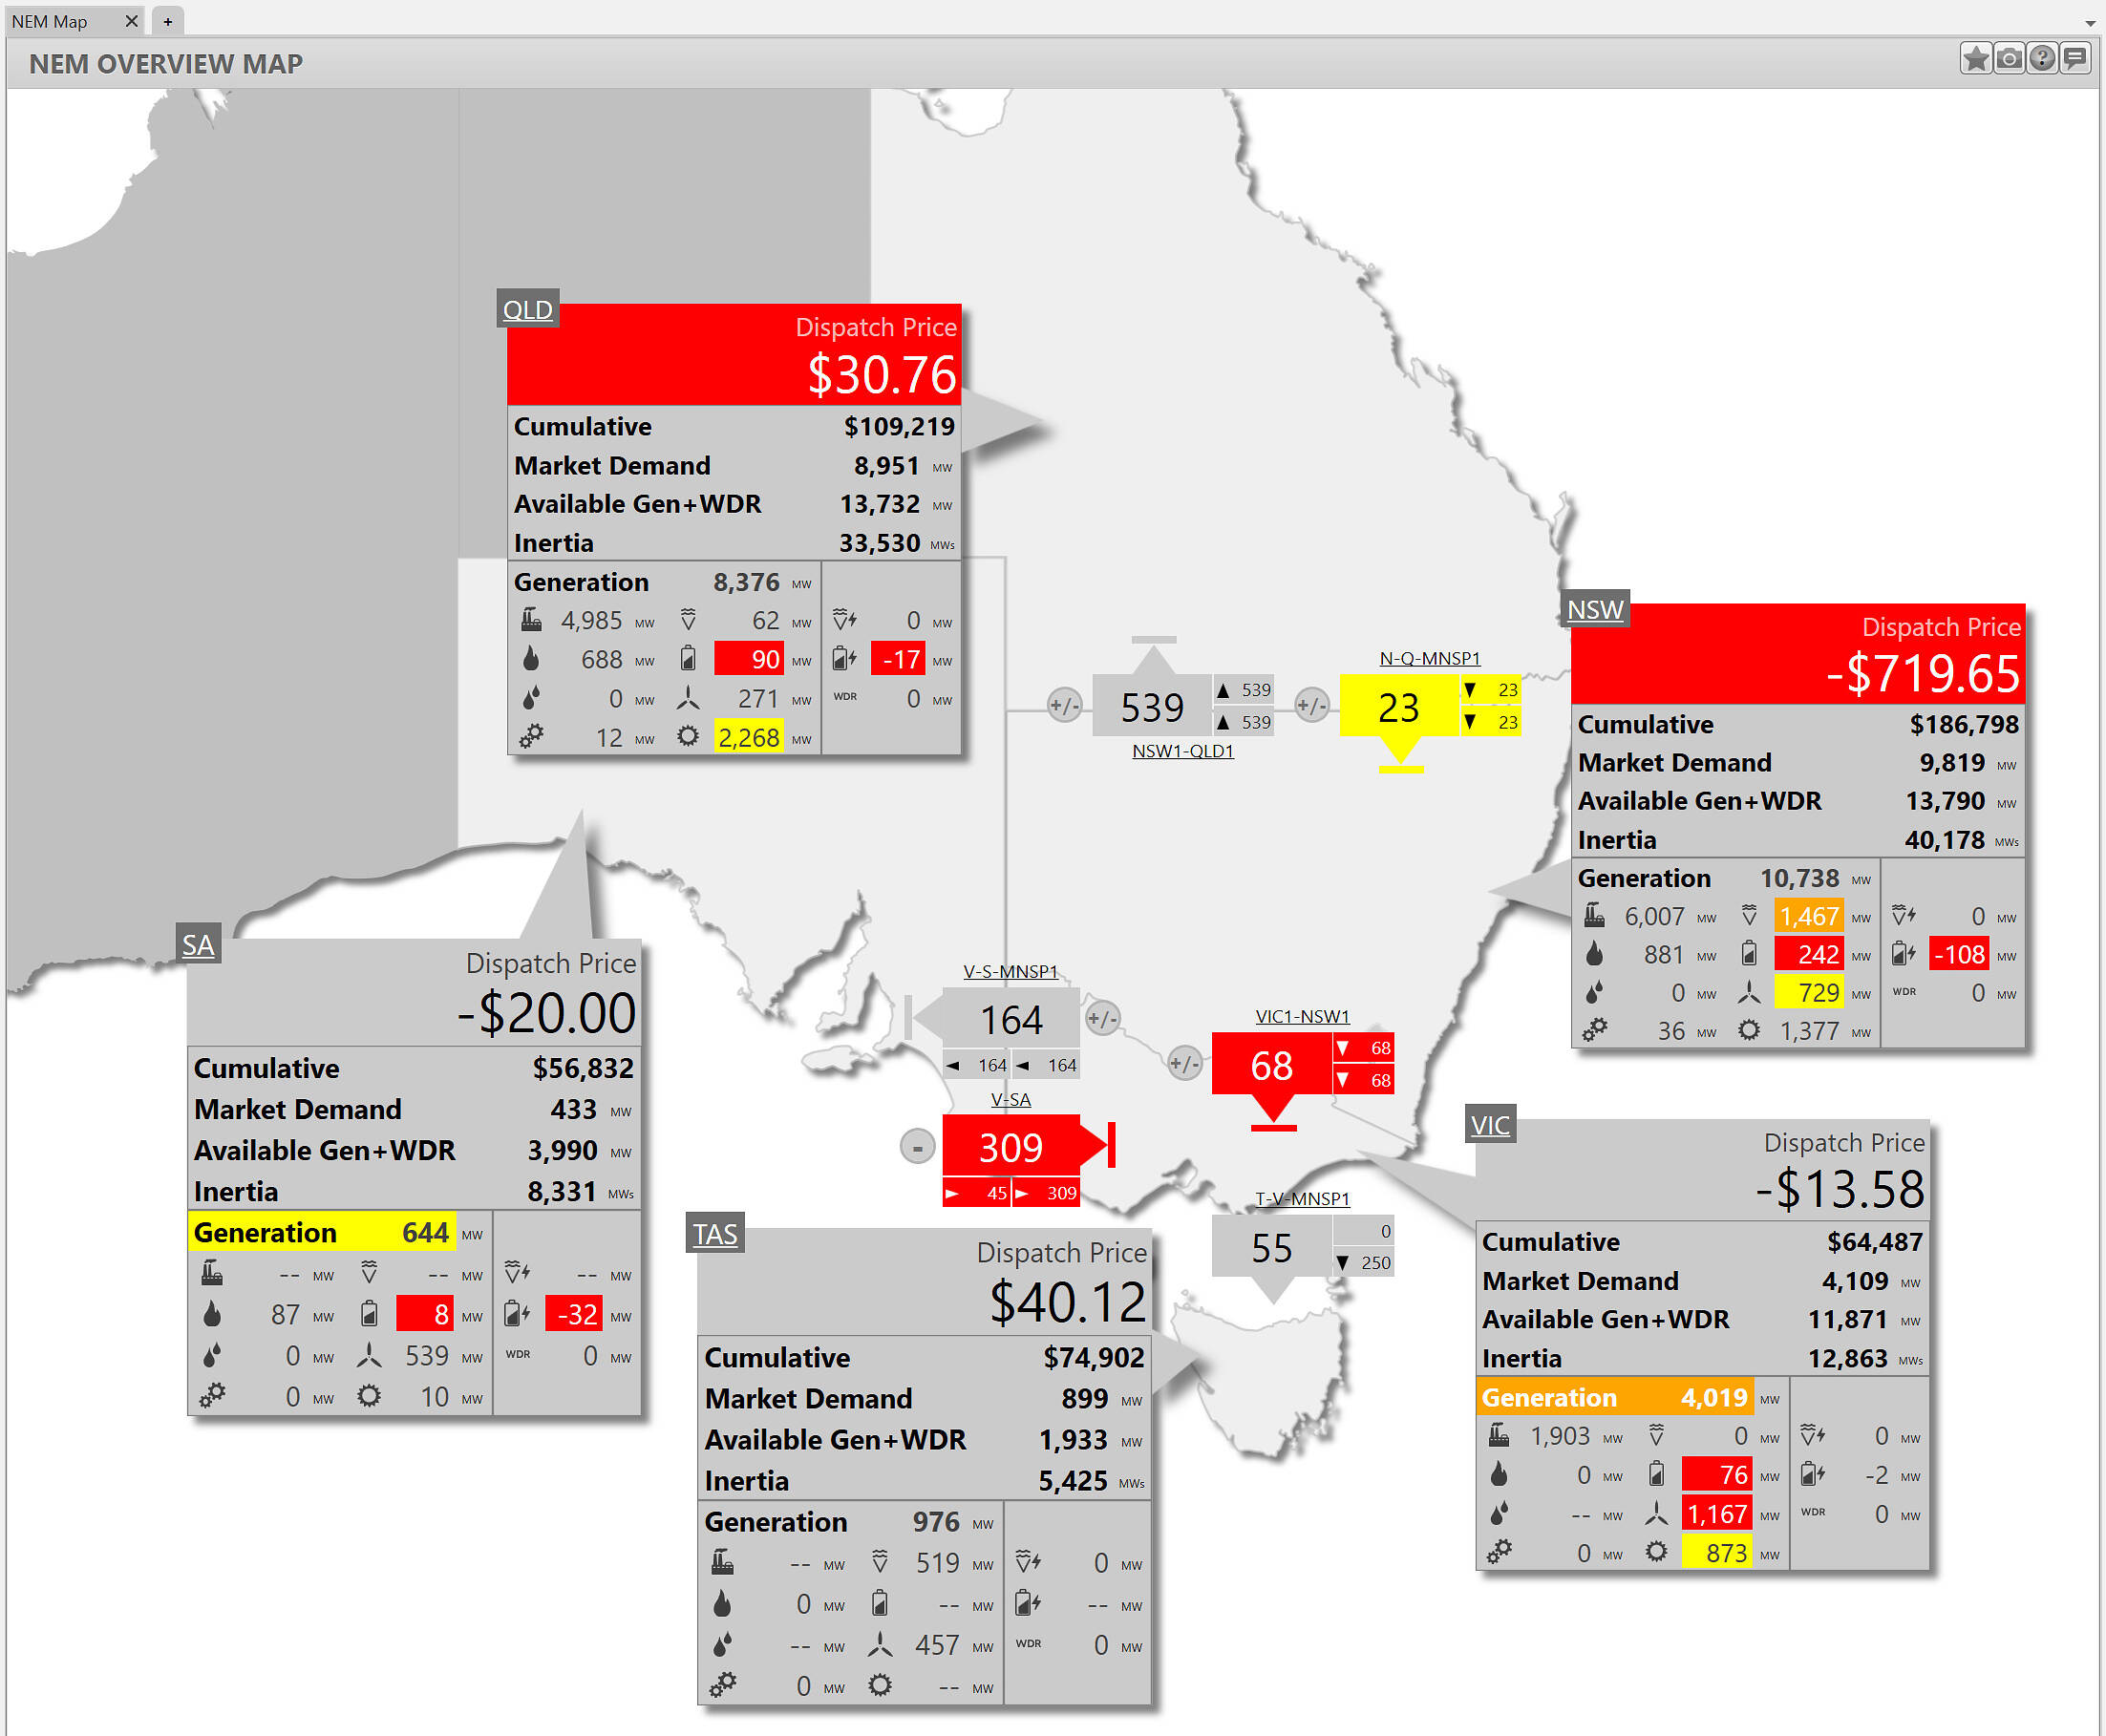
Source: ez2view’s NEM Map Widget. Screenshot taken at 3:45pm NEM time.
The period of ultra high prices and the period of ultra low prices were so short-lived that the region’s battery fleet had only a narrow window to respond — limiting their ability to fully capitalise on the large spread.
Notably, a meaningful share of the NSW battery fleet appears to have been discharging during the later dip in prices, making it all the more interesting to review their bidding behaviour — and the forecast signals they were responding to — once bidding data becomes public from 4am tomorrow. If time permits over the coming days or weeks, we’ll aim to take a deeper dive into this.
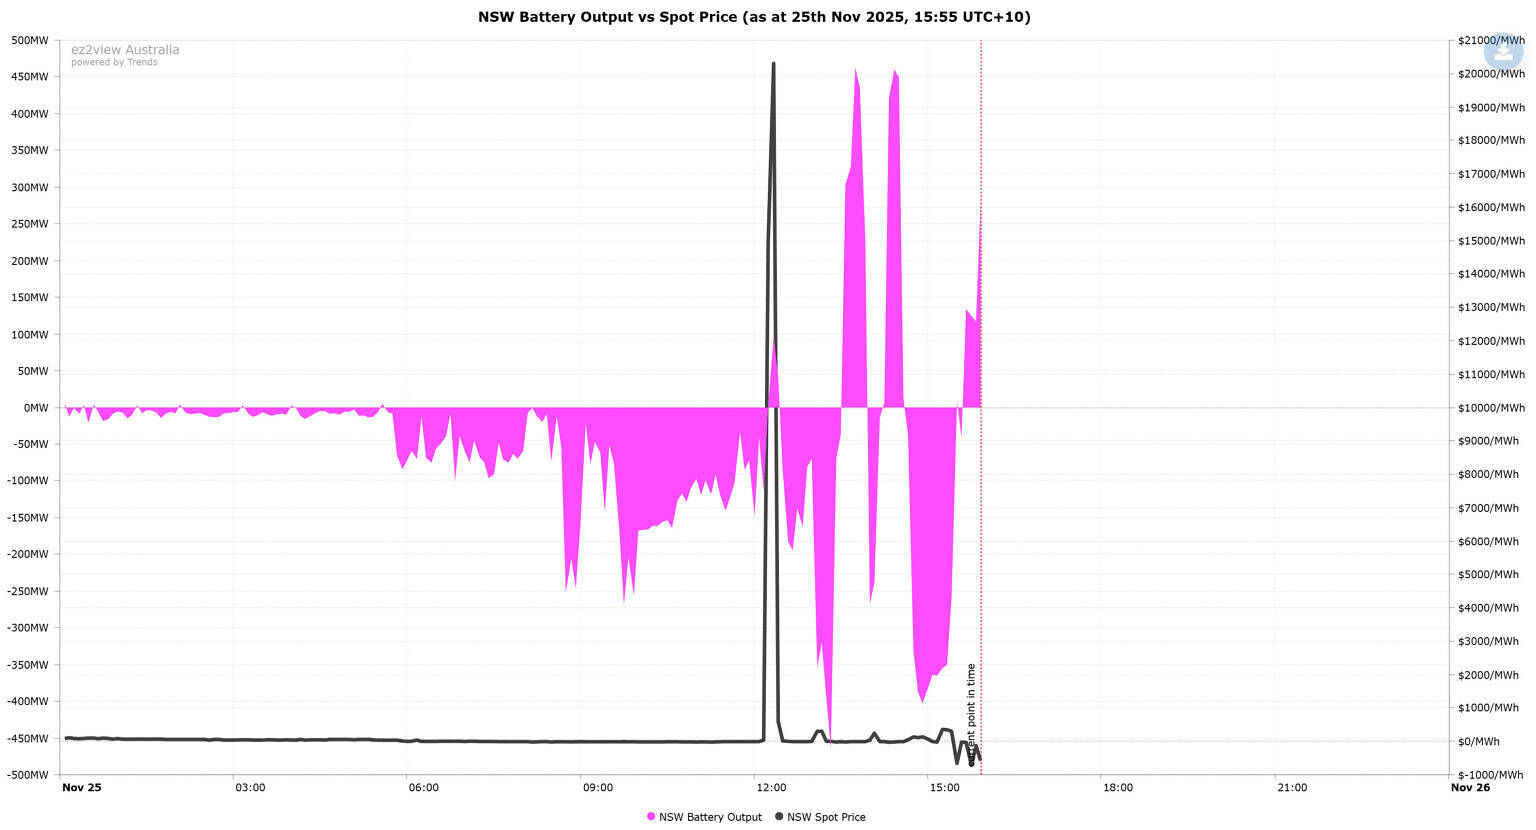
Source: ez2view’s Trend Editor Widget. Screenshot taken at 3:55pm NEM time.
Thanks, but of course an easy record to break every year given MPC is indexed 😉
Don’t forget that not so long ago we would get frequent intra half hour swings mpc to mfp. 5ms solved that.
Yes Ben both points are definitely true.
Interestingly, since the start of 5MS there have been relatively fewer occasions where a region has both hit the MPC and fallen deep into negative territory (well beyond “negative LGC” levels) in the same day. With the MPC making a step change up from July 1st — a 16% increase for FY25/26 — the gap between the market floor and cap has now widened beyond CPI too.
It seems to have been the Eraring battery ERB01
https://nemview.hgn.id.au/graph/dispatch_scada/NSW1/es2