Last Friday we posted ‘Peeling the second layer of the onion, with respect to the (SemiSched-induced) frequency weakness on Thursday 16th October 2025’ as part 2 in a growing series of articles following the observed ‘Weakness in frequency stability on Thursday afternoon 16th October 2025’ (i.e. Part 1).
A snapshot of the 16:50 dispatch interval
In this article, we focus specifically on 16:50 dispatch interval (NEM time) which:
1) in Part 1 we saw included the lowest point of System Frequency – down at 49.824Hz i.e. outside the NOFB at 16:49:07.6
2) and in Part 2 we saw included large collective under-performance across both Wind Farms and Solar Farms across the NEM:
(a) Across all Semi-Scheduled Solar Farms, a (harmful) positive Dispatch Error of +422MW (quite large!)
(b) Across all Semi-Scheduled Wind Farms, a (harmful) positive Dispatch Error of +422MW (coincidentally the same large amount!)
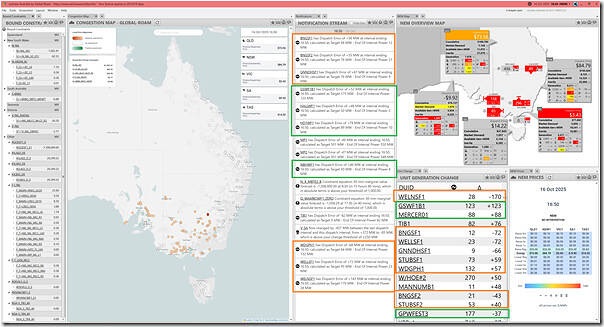
So we’ll start with this snapshot from ez2view at the 16:50 dispatch interval, to highlight broadly what was happening across the NEM at that time:
Pay particular attention to the large calculated Dispatch Error at the highlighted Wind Farms and Solar Farms (with the threshold in this alert at this time being larger than 45MW in either direction). We’ll focus in on the Solar Farms and Wind Farms individually now, given that they were the source of the instability (on this occasion, as seems to be increasingly the case).
For this explanation, readers might like to keep in mind:
- Linton’s explanation about ‘What inputs and processes determine a semi-scheduled unit’s availability’,
- and these Glossary notes about the Semi-Scheduled category,
… as these will come in handy to interpret some of the images below.
Looking across all Solar Farms
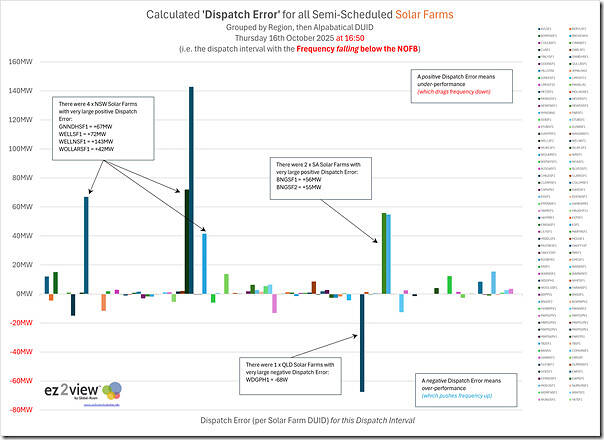
Let’s start with all Semi-Scheduled Solar Farms, with the per-DUID results summarised in this chart:
Of the 108 x registered Semi-Scheduled Solar Farms, we’ve highlighted 7 x DUIDs that had large Dispatch Errors…
- noting that we use 40MW as the threshold for ‘large’ here,
- primarily because it’s clearly different than the others, which are all <20MW).
- of these 7 x DUIDs:
- 6 of them unhelpful in this dispatch interval (contributing to dragging frequency down)
- and 1 of them helpful (trying to resist the frequency decline).
We’ll use the ‘Unit Dashboard’ widget from ez2view to have a look at each of them in turn…
The 7 x Solar Farm DUIDs with large Dispatch Error
We’ll start with the 4 units in NSW and then the 2 units in South Australia (all unhelpful in this Dispatch Interval) before showing the 1 unit in QLD that had a large helpful contribution:
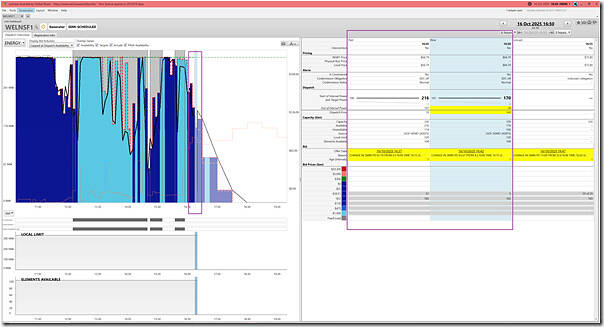
NSW Solar Farm (WELNSF1 = +143MW)
Here’s a view of the Wellington North Solar Farm at the the 16:50 dispatch interval;
This unit had the largest Dispatch Error, in either direction. With this unit:
1) At the 16:45 dispatch error, the output was not too far away from the Target (a Dispatch Error of only +19MW)
2) But whereas the Target trajectory was for a moderate decline to 16:50 (i.e. 197MW to 170MW Target), the actual trajectory was much steeper (197MW to 28MW), delivering a Dispatch Error of +143MW.
… my first guess here is some form of cloud cover that the ASEFS algorithm did not foresee?
3) We can see, via the 6-hour history, that the Availability has been bouncing up-and-down over the recent history, which seems to support my first guess of weather (cloud) effects.
NSW Solar Farm (WELLSF1 = +72MW)
Assuming that this is the case (i.e. cloud effects) then it would be no surprise to see the neighbouring Wellington Solar Farm also in the subset of units singled out for a focused look.
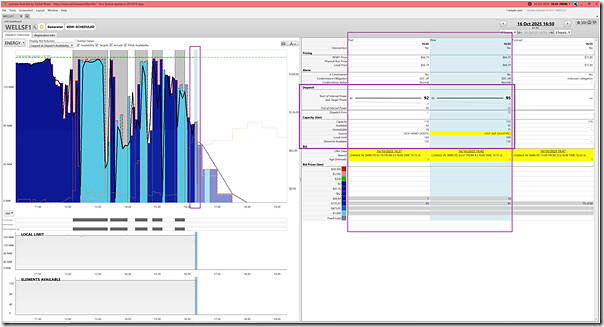
Here’s the ‘Unit Dashboard’ widget from ez2view at the the 16:50 dispatch interval:
With respect to this neighbouring unit:
1) It has the second largest Dispatch Error (of all Solar Farms), in either direction.
2) In this case, there are some similarities with the neighbouring unit above – in that the FinalMW is significantly below the Target provided for 16:50.
3) However (as a curiosity) we note that this unit flipped back from ASEFS to the Self-Forecast in the 16:50 dispatch interval:
(a) though the Availability was not much changed (i.e. 92MW at 16:45 slightly increased by 3MW to 95MW at 16:50)
(b) whilst, at the same time, the unconstrained output fell sharply (95MW to 23MW, or a Dispatch Error of +72MW)
4) So again we guess that there was some form of cloud cover that the self-forecast algorithm did not foresee?
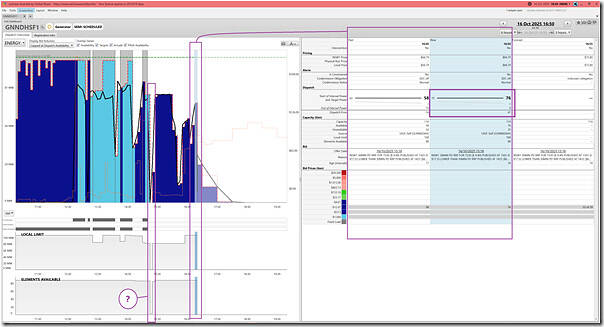
NSW Solar Farm (GNNDHSF1 = +67MW)
Here’s a view of the neighbouring Gunnedah Solar Farm at the the 16:50 dispatch interval;
This unit had the fourth largest Dispatch Error, in either direction. This case seems quite similar to the 2 x Wellington units above, in that we’re guessing some form of cloud cover that the self-forecast algorithm did not foresee?
Out of scope for this article, but the outcome at 15:20 (highlighted) is a curiosity …
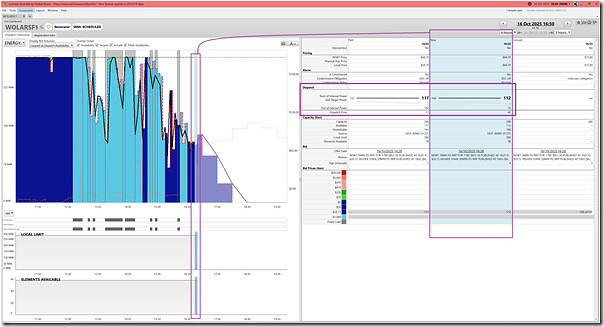
NSW Solar Farm (WOLARSF1 = +42MW)
Here’s a view of the neighbouring Wollar Solar Farm at the the 16:50 dispatch interval:
This unit had the seventh largest Dispatch Error, in either direction.
In this case:
1) Like the other units, it was mid-way through the afternoon decline;
2) With the see-saw pattern over the past few hours suggesting some form of cloud cover;
3) That just happened to (also) manifest for the 16:50 dispatch interval.
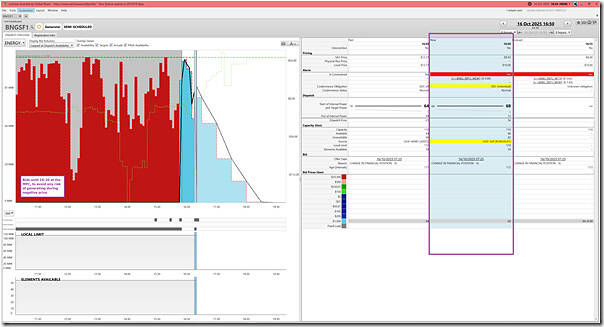
SA Solar Farm (BNGSF1 = +56MW)
Moving into South Australia, here’s a view of two siblings, starting with the older Bungala 1 Solar Farm at the the 16:50 dispatch interval:
With respect to this unit:
1) Because of the aversion to negative prices (via the PPA), we see the unit bids until 16:20 at the Market Price Cap
… but this means, in the context of the historical pattern of output, we don’t have as much history as we have above for the NSW units to judge cloud cover effects.
2) At 16:20 the unit bids to the Market Price Floor and so is dispatched up
3) But 30 minutes later (at 16:50) we see:
(a) A large drop in output not foreseen in the UIGF forecast from the self-forecast
(b) As such, a large Dispatch Error … which is 4th largest across the solar farms, in either direction.
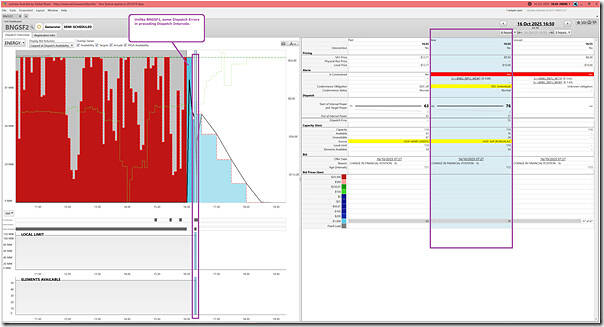
SA Solar Farm (BNGSF2 = +55MW)
Here’s a view of the neighbouring sibling (the Bungala 2 Solar Farm) at the the 16:50 dispatch interval:
With respect to this unit:
1) There’s much in common with BNGSF1 – but some differences as well
2) Differences include:
(a) For unknown reasons, the unit waits till 16:35 to shift volume down to the –$1,000/MWh bid band (i.e. 3 dispatch intervals after BNGSF1); and
(b) Unlike BNGSF1, the dispatch intervals (after that but) before 16:50 show some noticeable Dispatch Error
3) But, for the 16:50 dispatch interval, an almost identical Dispatch Error result.
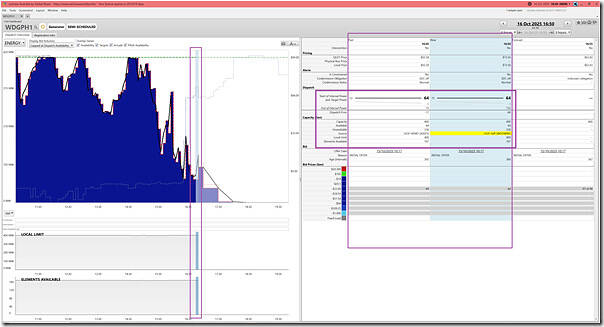
QLD Solar Farm (WDGPH1 = –68MW … helpful)
Here’s a view of the neighbouring Western Downs Green Power Hub Solar Farm at the the 16:50 dispatch interval;
Keeping in mind that this unit was the one with the large (helpful) negative deviation in this instance, there are some curiosities in terms of what happened:
1) At 16:45:
(a) with UIGF cAggregduced more … so a boost to frequency in the prior Dispatch Interval
2) At 16:50:
(a) with UIGF flipping over to the self-forecast as a source, the Availability was still 64MW;
(b) so this was (again) the Target … with the unit still unconstrained;
(c) In this instance, the unit over-performed by even more (i.e. FinalMW to FinalMW ramp of output increased)
… but this was beneficial to frequency in this instance.
The remaining 101 x Solar Farm DUIDs
However it’s also useful to highlight that the remaining 101 Solar Farms:
1) Combined to give an aggregate Dispatch Error of +55MW (also unhelpful)
2) With 56 units having positive Dispatch Error, compared to 41 units having negative Dispatch Error (i.e. even the remainder, with smaller individual deviations, were collectively unhelpful).
Looking across all Wind Farms
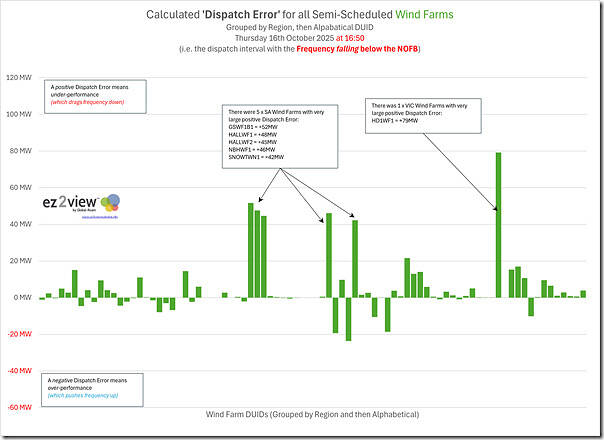
Let’s start with all Semi-Scheduled Wind Farms, with the per-DUID results summarised in this chart:
Of the 84 x registered Semi-Scheduled Wind Farms, we’ve highlighted 6 x DUIDs that had large Dispatch Errors – all of these unhelpful in this dispatch interval (contributing to dragging frequency down) in this dispatch interval.
Again, we’ll use the ‘Unit Dashboard’ widget in ez2view to have a look at each of them in turn…
The 6 x Wind arm DUIDs with large Dispatch Error
We’ll start with the 5 shortlisted wind farms in South Australia, and then look at the single shortlisted wind farm in Victoria (though note that the Victorian farm had the biggest Dispatch Error):
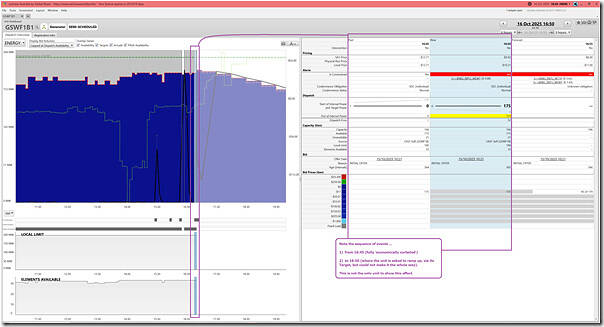
SA Wind Farm (GSWF1B1 = +52MW … unhelpful)
Here’s a view of the Goyder South Wind Farm 1B at the the 16:50 dispatch interval:
With respect to this unit:
1) It’s a large unit (MaxCap = 196MW) that is a relatively recent addition to the SA region
2) With respect to the focused Dispatch Interval:
(a) We can see that the unit (with volume bid at –$11/MWh at the SA RRN) was ‘out of the money’ at the 16:45 dispatch interval, and so was fully ‘economically curtailed’.
(b) At 16:50, we see that:
i. the RRP rose to –$9.92/MWh at the RRN
ii. The Local Price for the unit rose also, but not quite as much, because of the small effect of the lightly constrained ‘S>>BRBG_RBTU_WEWT’ constraint equation.
iii. The Local Price was still above its bid price, however, so the unit was above to generate.
iv. It was given a Target of 175MW … which was its full complement of Availability (with the Availability delivered by the self-forecast on the unit)
v. However at the end of the dispatch interval, the unit had only made its way to 123MW … so a ‘Dispatch Error’ of +52MW (i.e. underperformance).
3) This under-performance was one of many large ones (across the Semi-Scheduled Solar and Wind fleet) that we can see dragged frequency below the NOFB.
SA Wind Farm (HALLWF1 = +48MW … unhelpful)
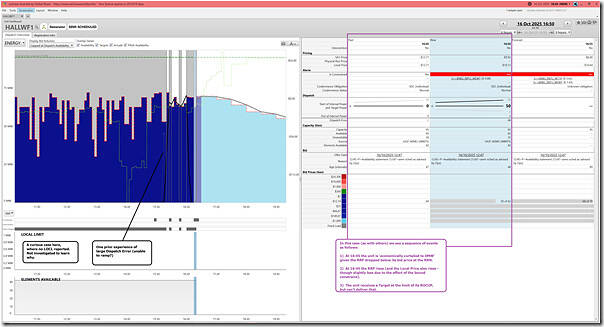
There were 3 of the 4 x Hallett wind farms that made the list of >40MW Dispatch Error. The first (HALLWF1) was the largest of the 3 at the the 16:50 dispatch interval:
With respect to this unit:
1) With respect to the prior Dispatch Interval (i.e. 16:45):
(a) We can see that the unit receives a Target of 0MW (i.e. because its bit at –$12.74/MWh is above the RRP (-$13.74)
(b) So the unit is ‘economically curtailed’.
2) Stepping then to the 16:50 dispatch interval, we see that:
(a) the RRP rose to –$9.92/MWh at the RRN
i. The Local Price for the unit rose also, but not quite as much, because of the small effect of the lightly constrained ‘S>>BRBG_RBTU_WEWT’ constraint equation.
ii. The Local Price was still above its bid price, however, so the unit was above to generate.
(b) It was given a Target of 50MW
i. Which is limited by the ROCUP rate …
ii. nothing that the Availability from AWEFS was at 62MW
(c) But with the FinalMW of only 2MW:
i. it almost completely missed its signal to start/ramp … which was its full complement of Availability (with the Availability delivered by the self-forecast on the unit)
ii. Which resulted in a ‘Dispatch Error’ of +48MW (i.e. underperformance).
3) This under-performance was one of many large ones (across the Semi-Scheduled Solar and Wind fleet) that we can see dragged frequency below the NOFB.
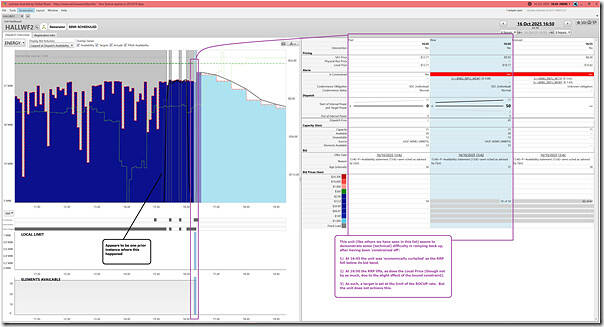
SA Wind Farm (HALLWF2 = +45MW … unhelpful)
Here’s a view of the neighbouring HALLWF2 Wind Farm at the the 16:50 dispatch interval:
This unit appears to be displaying similar (technical) difficulties to youngest sibling below (and the older one above) – in being unable to ramp back up to match its Target, after having been fully curtailed in the prior dispatch interval.
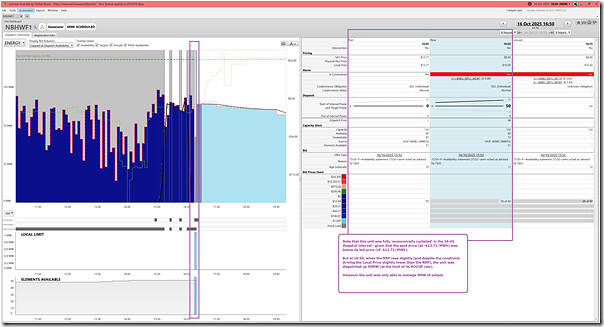
SA Wind Farm (NBHWF1 = +46MW … unhelpful)
Here’s a view of the neighbouring Hallett 4 (i.e. North Brown Hill) Wind Farm at the the 16:50 dispatch interval:
This unit appears to be displaying similar (technical) difficulties to its two younger siblings – in being unable to ramp back up to match its Target, after having been fully curtailed in the prior dispatch interval.
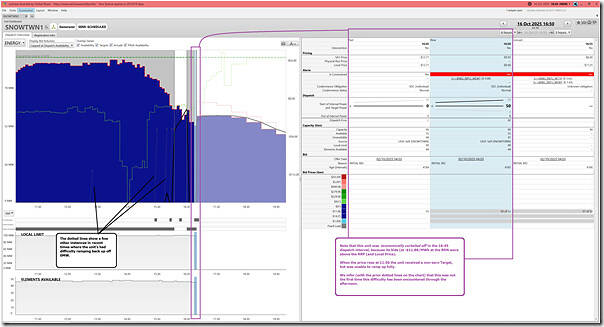
SA Wind Farm (SNOWTWN1 = +42MW … unhelpful)
Here’s a view of the Snowtown 1 Wind Farm at the the 16:50 dispatch interval:
Reading between the lines in the above, we wonder:
1) If this outcome demonstrates one more unit that has (technical?) difficulties with ramping back up after having been fully curtailed in the prior dispatch interval?
2) In this case, the history suggests other recent demonstrations of this.
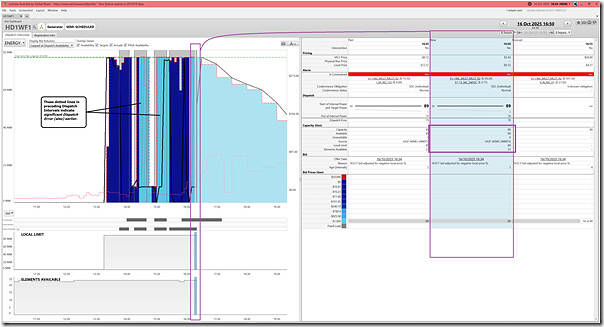
VIC Wind Farm (HD1WF1MW = +79MW … unhelpful)
Here’s a view of the Hawkesdale 1 Wind Farm in Victoria at the the 16:50 dispatch interval;
Briefly:
1) This was the (Wind Farm) unit with the largest Dispatch Error
2) We can see that:
(a) At 16:50, with volume bid down at the Market Price Floor at the RRN, the unit received a Target at 89MW (i.e. Availability from ASEFS at that point) … but was not able to increase, for unknown reasons
(b) The dotted lines in preceding Dispatch Intervals illustrate that there’s also been other large Dispatch Error recently as well (e.g. this had been the case at 16:40 and 16:45 as well).
The remaining 78 x Wind Farm DUIDs
However it’s also useful to highlight that the remaining 78 Wind Farms:
1) Combined to give an aggregate Dispatch Error of +111MW (i.e. even the remainder, with smaller individual deviations, were collectively unhelpful)
2) With 45 of those remaining units with positive Dispatch Error (unhelpful) compared to only 24 units with negative Dispatch Error (helpful).
Summarising, for Solar Farms and Wind Farms
Summing up, the 16:50 dispatch interval (NEM time) on Thursday 16th October 2025 saw:
- (in Part 1) the frequency dropping down outside the the NOFB … down at 49.824Hz at 16:49:07.6
- As shown in Part 2, this was because of the collective +844MW aggregate Dispatch Error across Semi-Scheduled Wind and Solar Farms
- This aggregate Dispatch Error would rank as a large addition to an update of this ‘tabular list of instances of large AggROT across Semi-Scheduled units’ to 30th June 2025.
- However the additional curiosity is that:
- Whilst the unhelpful contributions from Wind and Solar were (coincidentally) identical (i.e. +422MW each) the reasons for this dispatch interval
- The reasons behind these deviations appear quite different.
In the table below, we’ve summed up:
| Solar Farms
(Semi-Scheduled) |
Wind Farms
(Semi-Scheduled) |
|
|---|---|---|
|
All Units |
An aggregate Dispatch Error of +422MW |
An aggregate Dispatch Error of +422MW
|
|
Large Dispatch Errors |
There were 6 units that had (unhelpful) Dispatch Error >+40MW:
… but also one unit with a helpful deviation (in QLD) Of the 6 units with unhelpful deviations:
So with the Solar Farms in this instance, the cause appears to be a collective weather issues.
|
There were 6 units that had (unhelpful) Dispatch Error >+40MW:
Of these:
So with the Wind Farms in this instance, the cause appears to be a collective technical challenge. |
|
Remaining Units |
Of the remaining 101 Solar Farm units:
The causes of these (larger number of) smaller deviations have not been investigated.
|
Of the remaining 78 Wind Farm units:
The causes of these (larger number of) smaller deviations have not been investigated. |
That’s where we will leave this, for now … but I am curious as to whether the same differences between wind-and-solar were present in the earlier Event 2 (noted in Part 2) on that day.


Be the first to comment on "Taking a first focused look at the 16:50 dispatch interval on Thursday 16th October 2025 (with frequency dropped below NOFB) … Part 3"