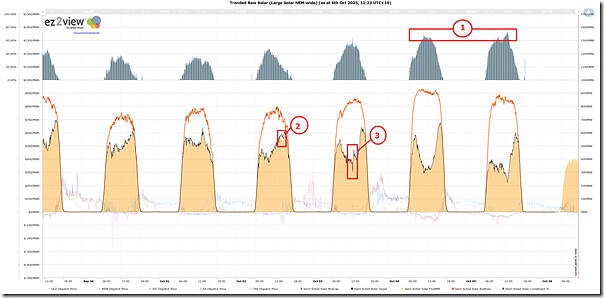
Worth a short note today to include this trend of aggregate trend of aggregate performance across all Semi-Scheduled Solar Farms across the NEM over the past week:
The dashboard chart (produced in the ‘Trends Engine’ within ez2view) reveals a number of interesting things, of which I have highlighted the following three:
1) Through the weekend just passed, we see that aggregate solar curtailment (i.e. both network curtailment and economic offloading):
(a) was above 60% on both Saturday 4th October 2025 and Sunday 5th October 2025 … and even briefly on Friday 3rd October 2025;
(b) But breached 70% on Sunday 5th October 2025
i. Scanning quickly the data (so might have missed something), this peaked at 13:05 (NEM time) at 73%
ii. At this time, aggregate supply from Large Solar across the NEM was only 2,159MW (i.e. FinalMW) … with 6,145MW of potential output spilled for both
iii. A caution for readers in reading false specificity into these numbers, given the challenges previously in “measuring” curtailment (as explained by Marcelle in June 2020 and in other articles subsequently).
2) Also quite visible is a period of collective underperformance across all Semi-Scheduled Solar Farms on Thursday afternoon 2nd October 2025:
(a) Which would have calculated as a positive Dispatch Error;
(b) And would have been one of the factors (if not the most significant factor) causing frequency to wander south in the afternoon.
3) Also early afternoon Friday 3rd October 2025 was a notable dip (at 12:35) than spike (at 13:00) in output in quick succession.
… which we might investigate further at another time….
Helps to highlight the reasons why BW02 might have decided to two-shift on both days on the weekend.
But that’s all for now.


The title should of course have been 5th October
Suggestion for an article:
To which extent were recent NSW market interventions caused by calculations as described in:
26/09/2025
“A minimum level of synchronous generation must be in service to ensure the stable operation and protection of the New South Wales transmission network. Transgrid and AEMO have jointly agreed that this requirement is met when the equivalent of six large synchronous generators are in service. Under these conditions, the network is considered to be in a satisfactory state. To be considered secure, the network must still have the equivalent of six large synchronous units in service after any credible contingency— typically the loss of the generator with the highest contribution”
https://www.aemo.com.au/-/media/files/electricity/nem/security_and_reliability/congestion-information/2024/transfer-limit-advice—system-strength-nsw.pd
Suppose Eraring were to shut down, would that number be (12-4)=4?
What other criteria are there for the minimum of rotational, synchronous inertia in the grid? How about imports?
The title should of course have been 5th October
Suggestion for an article:
To which extent were recent NSW market interventions caused by calculations as described in:
26/09/2025
“A minimum level of synchronous generation must be in service to ensure the stable operation and protection of the New South Wales transmission network. Transgrid and AEMO have jointly agreed that this requirement is met when the equivalent of six large synchronous generators are in service. Under these conditions, the network is considered to be in a satisfactory state. To be considered secure, the network must still have the equivalent of six large synchronous units in service after any credible contingency— typically the loss of the generator with the highest contribution”
https://www.aemo.com.au/-/media/files/electricity/nem/security_and_reliability/congestion-information/2024/transfer-limit-advice—system-strength-nsw.pdf
Suppose Eraring were to shut down, would that number be (12-4)/2=4?
What other criteria are there for the minimum of rotational, synchronous inertia in the grid? How about imports?