Last week I was able to post some analysis of very modest demand peaks seen in Victoria and South Australia across the summer 2014-15, and across the whole of the NEM.
Today I provide the same sort of analysis for the NSW region. Given the NEM-wide peak was so low, I began this analysis with an expectation that the peak demand for NSW would be reasonably low, as well.
1) What actually eventuated?
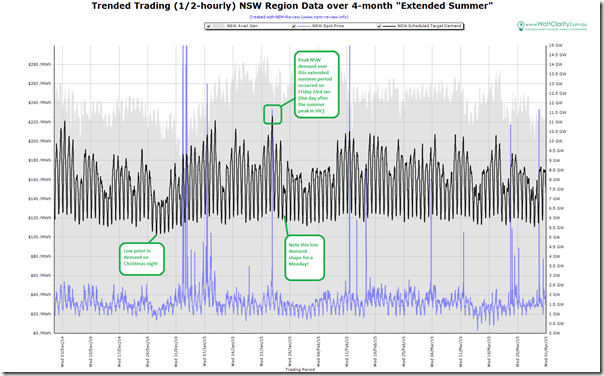
To provide an overview of what happened over summer in NSW, we once again reach for NEM-Review to produce this trend:
On this chart we have highlighted how the demand peaked to a level of 11,395MW on 23rd January, which was one day following the peak in Victoria for this summer.
We see only 2 other days where demand rose above 11,000MW, and 22 more (out of 120 in total) where demand even rose above 10,000MW. Hence this confirmed our expectation that the data would show a low demand summer.
2) How well was this expected?
This summer, in conjunction with our traditional “main prize”, we also offered to give away a “consolation prize” for the closest to the market at guesstimating what the peak demand would be for the NSW region (this was Competition #3 of a total of 7 competitions this summer).
2a) Was it expected, by our competition entrants?
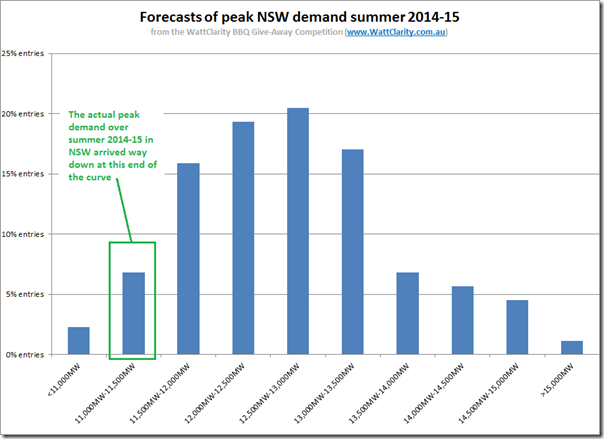
Collating all the entries and plotting a distribution, we see this pattern:
As we can see, the demand peak underwhelmed 90% of our entries.
The bulk of the entries fit in a 2,000MW range beginning 11,500MW and ranging up to 13,500MW.
SO WHO WINS THE “CONSOLATION” PRIZE FOR COMPETITION #3 (NSW PEAK) THIS SUMMER?
One person who probably does not mind the fact that demand was on the low side in NSW this summer – and so increased the likelihood that their low-range entry in the competition would stand a chance, is the one who will be enjoying their new portable BBQ prize, from Barbeques Galore as revealed here…
One other point to note is the large range of entries compared to other regions (particularly Tasmania and Queensland) – illustrating a higher degree of uncertainty of even how many thousands of MW the peak demand will be each summer in NSW.
2b) Was it expected, by AEMO?
During the (slow Christmas and New Year) weeks when the 7 competitions were open to entrants, we posted some tips about most of the 7 – but did not find time to post any tips about NSW.
However on 28th January (i.e. after the peak summer demand had been reached – it turns out) I did post about how forecasting peak summer demand would be harder than it might have originally seemed.
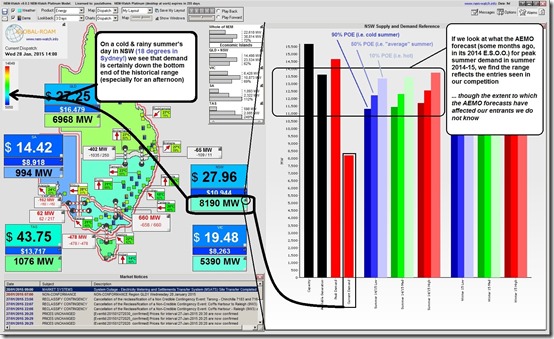
In that post, I included a snapshot of NEM-Watch highlighting what the AEMO had been forecasting for peak summer demand under each of their 9 different scenarios – this is copied below for ease of reference:
Reading off this chart, it appears that the 11,395MW level was at the very bottom end of the AEMO’s range of expectations (i.e. a scenario loosely described as “very mild summer”, and with with poor economic conditions as well).
No wonder we’d not seen the NSW region colour scaling not budge out of the blue/green zone in our NEM-Watch dashboard running 24×7 in the office over the whole of summer!
3) Looking in more detail?
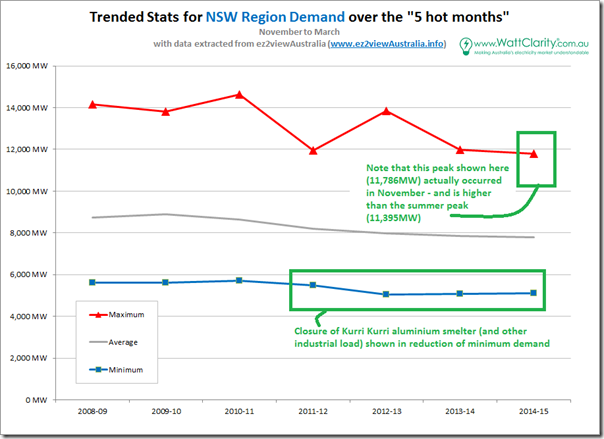
As we did for other regions last week, we include this trend of the headline stats for NSW for the “5 hot months” of 2014-15 and the 6 preceding financial years:
As indicated on this chart, we actually found instances of higher demand in NSW occurring in November 2014 (so out-of-scope for our competition) than actually occurred during the “extended summer” period!
Even with the added (400MW) uplift of the higher demand in November, we see that the demand peak in this 5-month period was similar to other cooler summers (2011-12 and 2013-14) and more than 2,000MW below the peaks reached in summers when the mercury rose!
Also highlighted is the effect that can be clearly seen of the closure of the Kurri Kurri aluminium smelter during 2012 (with the final pin pulled in 2014). Other industrial plants have also closed (e.g. Caltex Kurnell refinery) but their average consumption was smaller.
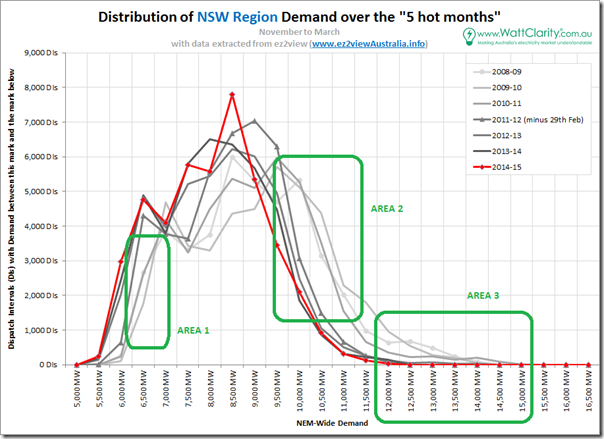
To provide more detail, we generated the following distribution curve for NSW:
With respect to this curve, a few key points are evident:
3a) Minimum demand
We can clearly seem in Area 1 marked at the bottom end of the curve, the most significant shift to the left registered from 2010-11 to 2011-12, and also from 2011-12 to 2012-13.
This correlates with the closure of Kurri Kurri.
3b) Afternoon demand
In Area 2, also marked on the chart, we can see that the curves equating to ordinary afternoon demand have seen the curve also shift to the left – to a larger degree, taking into account the compounding effect of industrial load closure but also the effect of other factors (like solar operating behind the meter during sunlight hours).
In reading the chart, see that the most significant shift occurred from 2010-11 to 2011-12 at this end of the chart.
3c) Peak demand
As with the other regions, the absolute measure of peak demand has been more random given the effect of weather extremes (and the variability of this).
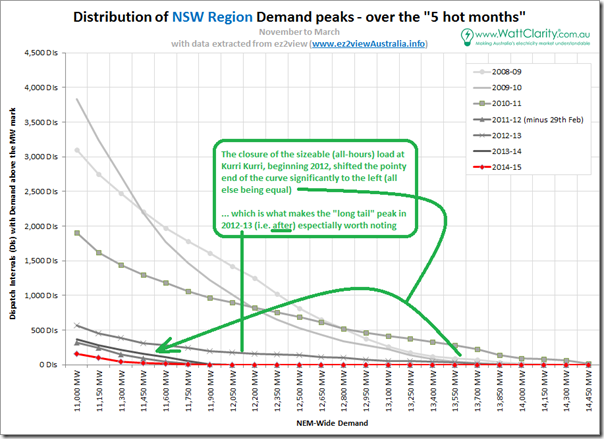
For a closer look we provide the same zoomed-in (and cumulative) focus at the section marked “Area 3” above:
The miserable peak recorded for summer 2014-15 can be clearly seen on the chart.
What particular stands out to me, however, is the amazingly “long tail” distribution of peak demand for the period Nov 2012 to December 2013.
To be clear, this was after* several hundred megawatts of demand at Kurri Kurri had been removed from the system. And yet the curve for 2012-13 reaches almost as high as the all-time record (2010-11), and is very, very flat – another indicator that the peak demand problem might be getting worse?
* it is noted here that “Hydro closed the Kurri Kurri plant’s remaining primary metal production in September 2012, and stopped producing casthouse products in October 2012.” Hence I believe this means that the Kurri Kurri load would not show up in data for 2012-13 shown in this analysis.
As with all regions, we will watch with interest to see what happens in NSW, moving forwards.


Leave a comment