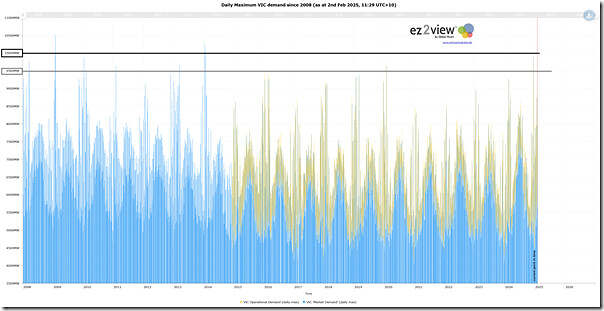
Yesterday we posted ‘A trend of daily peak NEM-wide ‘Market Demand’– from 1st January 2008 to 31st January 2025’.
Given the attention on the forecast demand in Victoria for the coming days with the heatwave (including here, but also elsewhere) we thought it would be useful to also publish the same type of analysis, but just for the Victorian region….
(A) A brief reminder about the complexity of measuring ‘Demand’ …
…. because it’s not as simple as some might initially think.
Note this ‘A brief reminder about the complexity of measuring ‘Demand’ …’ here.
With this in mind, let’s look on….
(B) A long-range trend of daily peak
So utilising the ‘Trends Engine’ within ez2view we’ve put the following trend together, showing both ‘Market Demand’ and ‘Operational Demand’ (noting that reconstructing an estimate of ‘Underlying Demand’ over such a long time range is more complex and we don’t have time to do this today for this brief article.
Remember to click on the image for a larger-resolution view.
For ease of reference, I’ve added a horizontal line:
- at 10,000MW (only 8 days have ever seen higher) and
- at 9,500MW (only 16 days have ever seen higher … in 6,242 days (so 0.26% incidence)
(C) A tabular listing of some of those high demand days
With the above chart as a reference, here’s some of the high points in each year noted (with some linked to articles written at the time).
| Year | Brief Explanation of the top demand days (in Victoria) in each year,
in terms of ‘Market Demand’ |
|---|---|
|
2008 |
1 day over 9,500MW:
|
|
2009 |
3 days over 10,000MW in January 2009::
|
|
2010 |
3 days over 9,500MW:
|
|
2011 |
1 day over 9,500MW:
|
|
2012 |
0 days over 9,500MW |
|
2013 |
1 day over 9,500MW:
|
|
2014 |
5 days over 10,000MW in January 2009::
… and then, after a week’s break:
|
|
2015 |
0 days over 9,500MW |
|
2016 |
0 days over 9,500MW |
|
2017 |
0 days over 9,500MW |
|
2018 |
0 days over 9,500MW |
|
2019 |
0 days over 9,500MW |
|
2020 |
January 2020 saw :
|
|
2021 |
0 days over 9,500MW |
|
2022 |
0 days over 9,500MW |
|
2023 |
0 days over 9,500MW |
|
2024 |
Monday 16th December 2024 reached 9,887MW. |
|
2025 ytd |
This year is only very young … only 1 month + 1 day old.
… and that’s before even thinking about ‘Underlying Demand’, which would be higher still. |
So let’s wait to see what unfolds…


Leave a comment