Stuck in the office this week, with the rain-affected ![]() cricket playing on the radio & the phone very, very quiet, my mind turned again to our summer competition (where, this year, we’re giving away 7 different BBQs in seven different – but related – competitions).
cricket playing on the radio & the phone very, very quiet, my mind turned again to our summer competition (where, this year, we’re giving away 7 different BBQs in seven different – but related – competitions).
Already this summer, we have posted the following hints on WattClarity (with other snippets Twitter) to assist you in posting your entry for each competition:
Competition #1 – peak NEM-Wide demand (and grand prize) – no hints yet – and you only get one entry here, so make it count!
Competition #2 – peak QLD demand (and consolation prize) – see these hints last week and these ones too – another 12 entries possible for you, including today
Competition #3 – peak NSW demand – no hints yet, but you can still start your early entries now.
Competition #4 – peak VIC demand – no hints yet, but you can still start your early entries now.
Competition #5 – peak SA demand – see the hints below – another 12 entries possible for you, including today
Competition #6 – peak TAS demand – no hints yet, but you can still start your early entries now.
Competition #7 – peak Wind production NEM-Wide (and consolation prize) – see these hints last week – another 12 entries possible for you, including today.
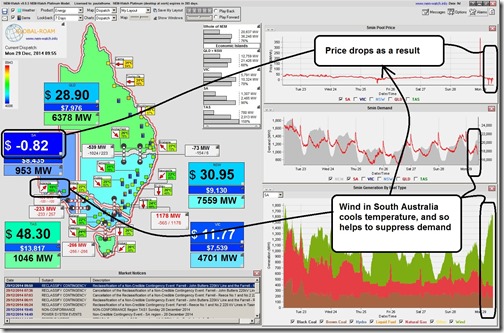
Today we turn our attention to the South Australian region, where the following snapshot from NEM-Watch earlier today sums up part of the difficulty inherent in forecasting what the peak Scheduled Demand target will be for this extended summer period:
From experience we have seen that wind output and Scheduled Demand in South Australia is somewhat inversely correlated (such as in this post following winter 2012) – or, in other words, when Scheduled Demand (the subject of this competition) has been high in South Australia, wind production has been more likely to be low. In the two years since that post, one of the most significant developments that South Australia has seen has been the growth of solar PV injections into the grid which, it would seem, would tend to be highest at times when the demand in South Australia might otherwise peak (i.e. on hot, sunny days).
Finally, it is partly because we remember the prolonged heatwave experienced in South Australia through March 2008 that we are using a definition of “extended summer” to include March 2015 in what we’re calling Summer 2014-15 in this instance.
Hence it will be with great interest to see where peak Scheduled Demand actually lands for South Australia over this extended summer period. What will your entry be today (keeping in mind that you can enter up to 12 times (including today, through until 9th January)?
You might want consider the following tips:
1) What was AEMO forecasting might be the peak demand this summer in South Australia?
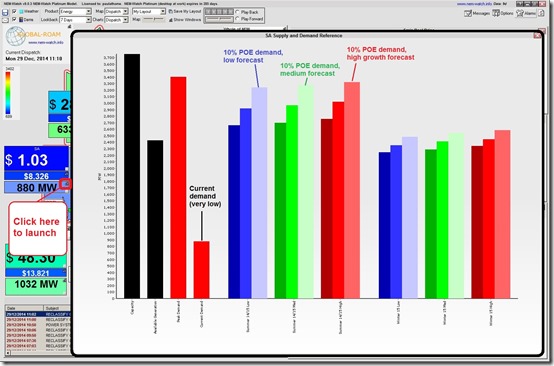
We noted here how you can use NEM-Watch to drill into AEMO’s forecasts for peak summer and winter demands (from the latest Electricity Statement of Opportunities). Here’s what is shown for the peak forecasts for South Australia this summer:
As we can see in the above, AEMO’s forecasts for the “extreme” weather case was that the scheduled demand in South Australia would approach – but not quite exceed – the all-time record demand peak experienced several years ago.
But how hot will it actually get this summer in South Australia? There are a number of different forecasts you might like to consult to help you form your own view – including those from the BOM, and from third party providers like MetraWeather, WeatherZone and Weather Risk Management Services (in no particular order).
2) How has demand trended in the past?
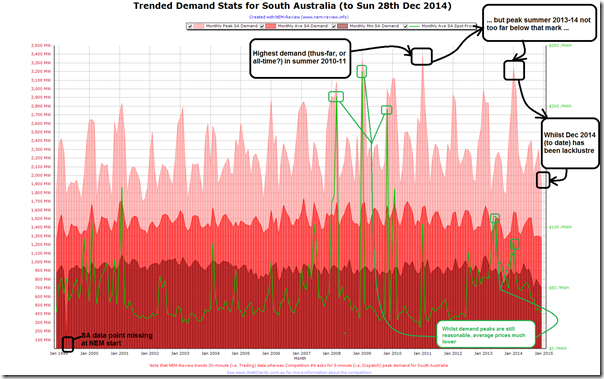
Powering up NEM-Review to quickly look back over the 16 years of elapsed NEM history, we see the very “peaky” nature of the demand in the South Australian region (especially in comparison to Queensland, which has a much flatter demand distribution).
Scheduled demand in South Australia, thus far this summer, has been very underwhelming – meaning that the available range for entries in Competition #5 is very broad (relative to what the all-time maximum demand has been in the South Australian region).
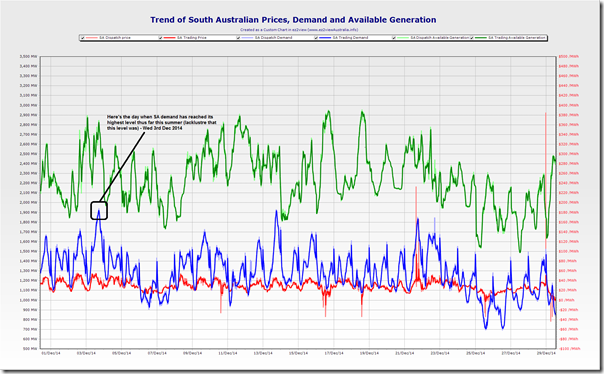
To ensure everyone can have the same starting position in terms of their entries into Competition #5, we open up a Custom Chart in ez2view to trend 5-minute (Dispatch) and 30-minute (Trading) data for South Australia as follows:
The key number we need from the chart above is 1,944.4MW at 17:10 (NEM time) on Wednesday 3rd December. Your entry will need to be higher than this to have any chance of winning.
Where the peak demand lands will depend, significantly, on what happens with the weather in South Australia – including windiness, solar incidence, and temperature. As shown in the analysis above, it might even approach twice what the peak demand has been so far this summer.
3) Given the strong sensitivity to weather…
Given the strong sensitivity of peak demand in South Australia to weather, there’s a significant range between a “min” (i.e. the actual peak-so-far noted above) and a “max” (i.e. assuming extreme heat, coupled with low wind and relatively low solar as well – e.g. maybe cloud cover over Adelaide).
I’ve done a quick scan on entries-received-to-date and it seems that there are more entries towards the upper end of the range, than at the lower end of the range (now there’s a hint you might want to consider for at least one of your entries!)
Now that you have read through the above tips, don’t forget to email in your entry today …


Leave a comment