Well, we knew it would be hot across Queensland this week, and hence last Friday AEMO had indicated the likelihood of high demand (particularly on Monday, Tuesday and Wednesday).
With our NEM-Watch v10 entry-level dashboard we’ve been keeping a close eye on how the Scheduled Demand had been performing through today. By the time I had left the office today I’d seen the old record eclipsed by a handful of megawatts (9,482MW at 16:55 – eclipsing the old record by 5MW). Hence I’d gone home noting that I’d have to make a quick post this evening marking something of some interest, but not astounding.
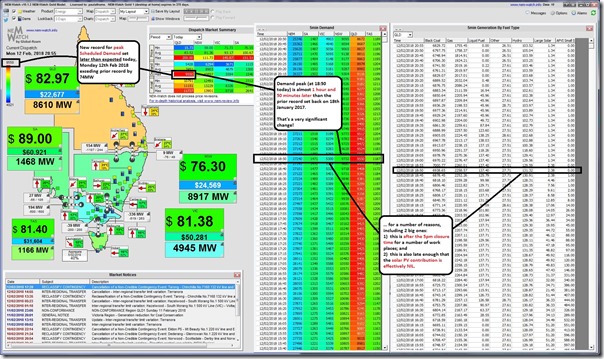
However checking back in at 20:55 with the temperature still stubbornly high, I am amazed to see that the new record for Scheduled Demand is actually 73MW higher than what we saw in January 2017. That’s an impressive increase on a prior record (especially given we know a number of large users which have backed off consumption because of volatility experienced in prior summers).
What’s particularly staggering is that this demand record was how late this was achieved. Peak Scheduled Demand was 9,550MW at 18:50 today!
My sense (I have not checked comprehensively, yet) is that this is much later than any prior peak demand record (for instance the prior record of 9,477MW was set at 17:00 on 18th January 2017).
Taking a snapshot from NEM-Watch v10 at 20:55 I have converted the demand and supply widgets to show tabular view and annotated with two significant take-aways:
As noted in the image, the fact that this record in demand arrived almost 2 hours later than it happened just last summer could signal a huge change for the Queensland region – because, at 18:50 local time:
1) Many businesses will have already packed up for the day and so the commercial contribution to peak demand will already have waned!
2) It’s also late enough that the contribution from solar PV has dropped to zero. Now I have been watching the peak Scheduled Demand shift later in the day because of the “duck curve” phenomenon (and have previously posted about this a number of times). It’s still startling when it actually happens, though, when peak demand shifts so far to the right on the time scale that solar contribution is nothing.
This is a remarkable development that will lead to some more head scratching – about firstly forecasting peaks in Scheduled Demand in future years, and secondly in actually meeting them.
Notable in its absence today…
One thing noticeable in its absence in Queensland today (and indeed across the whole of summer, to date) has been the (also stunning) lack of price volatility. A very different situation that that seen in the past 4-5 summers, from memory.
… but wait, there’s more (probably) coming this week
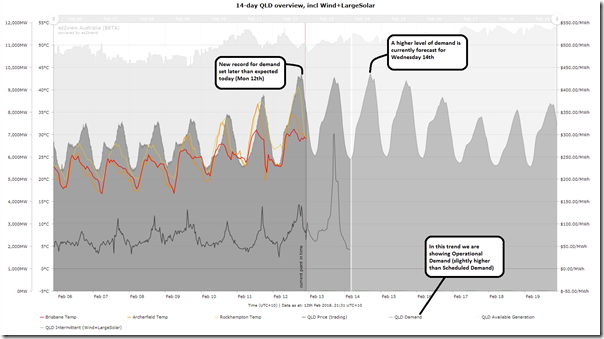
As a brief detour before hitting “publish” I dial up the pre-configured 14-day overview for the Queensland region that’s been configured in the Time Series Editor within ez2view and see (as noted) that the AEMO is forecasting more of the same tomorrow (Tuesday 13th) with an even higher peak in demand forecast for Wednesday 14th February.


There are some scary-impressive numbers being generated by AEMO’s POE10 forecast for tomorrow (Wed. 14 Feb). There is a value of 10,115MW @ 17:00 and 10043MW @ 16:30. In the Energex DAPR, they provide a 50 POE reference temperate at Amberley of 30.65C ([max+min]/2).
The reason I keep harping on the 10 POE is that private numerical meteorological forecasts for Wednesday has a forecast average temperate at Amberley of 31C.
A comment out of the Energex 2016 DAPR is interesting. “Importantly, while air-conditioning load growth is beginning to flatten, the sensitivity of the significant >>latent<< (my emphasis) air-conditioning load already on the network remains a challenge to manage.” Out of the 2017 DAPR this comment “Air-conditioner sales have been higher this summer indicating customers are more likely to update or add to the air-conditioning load in their homes in response to the hotter summer.”
And that is the key to what we are seeing. There was a gap in hot summers from 2010/11 to 2016/17 that coincided with the classic peak-demand time of three hot days in a row, in the middle of the working week, in February. The heat has returned with vengeance, and so too has the load.
Perhaps those customers who did run their air conditioners last summer were pleasantly surprised at their electricity bill, or have become re-addicted to the comfort of air conditioning.
Evidence suggests that customers have a “break point” with the heat. When it gets too hot, they will say “stuff the cost” and turn on their units.
Further, the more affluent who also have both solar PV and A/C, also appear to have a new behaviour to run their A/C hard, offsetting late afternoon and evening kWh consumption against export income during the day.
The peak demand is definitely an interesting challenge to manage. If the weather forecast holds, Wednesday will be interesting to watch as well.
Thanks Anthony
We’ll be watching what happens on Wednesday.
Paul
Looks like a new system record, but no 10POE cigar. Sea breeze front pushed in as far as Amberley (33kph ENE at 16:30).
I find it very interesting to read remarks about “managing peak demand”. Remarks like this reminds me of Soviet type think “managing” meaning “controlling”. Supply and consumption of electricity since Edison’s time has been on the basis that the consumer sets the load, rather like a customer enters a shop because THEY decide – not the shop. I think we need to stop talking about managing. Think about the structural steel in a building to resist a storm-wind that might blow at the design speed for 10 minutes every 100 years. At all other times there is a capital investment in steel that provides no tangible return on investment. Those involved in power designs need to get over worrying about peak to average ratios. Many industries have capital investment that is not needed for most of the time. Just spend the money !!!
Ken,
Managing peak demand has been around in the Queensland electricity industry for a very long time. The Brisbane City Council Department of Electricity introduced hot water load control using the Zellwegger system at Holland Park substation in 1957. Yes, over 60 years ago. (I believe the Sydney County Council introduced the same system a few years earlier). At present, there is approximately 1000MW of customer’s load in Queensland connected to Zellwegger demand management schemes. Over the decades, using the scheme has saved system operators from having to do load shedding during generation deficiencies. AEMO’s forbear (NEMMCO) once had the hot water systems in Queensland “instructed off” for an extended period during a significant generation shortfall.
Back in the 80’s, I did the field install for the under-frequency fast hot water shed. (A system that is still in operation today.) I doubt a single person notices when their hot water gets load shed. But everyone certainly does when the lights go out. Ironically, because this demand management system has worked – that is, it has prevented load shedding for standard lights & power – the concept does not attract media attention, and people assume that it does not exist.
I see little difference between centralised demand management and other flexible purchasing arrangements. For example, if I want to purchase a Qantas ticket from Brisbane to Sydney tomorrow. I can purchase a ticket for a 5AM flight out of Brisbane for $177, or I can purchase a 6:30AM flight for $490. If I can management my demand, I can save 64% of the price. Ditto cheap movie tickets on Tuesdays, and so forth. This is free market economics in action, straight out of the textbook for first year Uni students. There are options available for both buyers and sells, and both adjust their behaviours (ticketing prices and willingness to purchase) based on supply and demand. It does not bear even a passing resemblance to centralised control “Soviet” economies.
The thing that I find damn irritating is the collective social amnesia – most annoyingly from senior leaders inside the electricity industry – that parts of Australian electricity grid has a world class demand management system that works. Instead, the industry is accused of being behind the times and that we should do demand management by TCP/IP, or something like that …
Looks like QLD schedule demand peaked at a new record of 9928 MW today.
But returning to Feb 12, it’s worth noting that while scheduled demand peaked at 18:50 (9550MW), once you include the effect of rooftop PV, you can see demand (scheduled + rooftop PV) actually peaked at approx 9835 MW a couple of hours earlier around 17:00. So rooftop PV reduced the peak by about 300 MW, and moved it back a couple of hours.
Correction, looking at your data it appears that peak demand on Feb 12 (scheduled + rooftop PV) was around 9868 MW at 16:55 on Feb 12.