Today I’ve posted this broader review of the volatility experienced on Saturday 14th January in the wholesale physical (“spot”) market that is AEMO’s domain in the National Electricity Market. That article, and particularly the animation, focused wholly on the physical market.
However, as noted there, physical market volatility (in the current quarter) can flow through to high contract prices (in future quarters). It’s not strictly “logical” but instead is based on sentiment.
1) Many times we see how volatility wakes some people to the risk (they might be traders, or they might be energy users or other wholesale market customers) – which leads to higher volume requirements for hedge, so driving contract prices.
2) On rarer occasions, retailers (wholesale market customers) have gone bust – at least in part as a result of hedging strategies that perhaps ignored too much risk, till it came home to bite them. My understanding is that there were three of them – Jackgreen, EnergyOne and GoEnergy (feel free to correct).
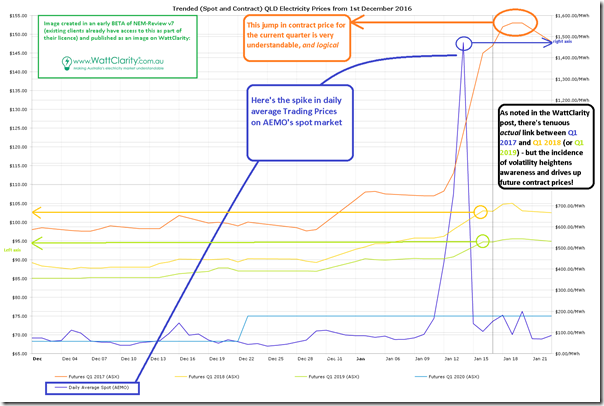
Using an early beta of NEM-Review v7 (already available to existing NEM-Review v6 clients, and also available in different forms to ez2view and deSide clients) I’ve generated this trend of both physical and financial contract prices for Queensland from 1st December 2016:
As noted on the chart, the spike in daily spot prices on January 14th has driven both:
1) A literal jump in the traded price of the Q1 2017 futures contract; and
2) A sentiment-driven jump (not so large, but still significant) in traded price for Q1 2018 and Q1 2019.
More on this at another time…


Leave a comment