Tuesday’s AFR contained an article titled “Infigen back in the black, buries talk of merger” (online here under a slightly different name) which made for interesting reading – particularly the part that reads:
“Profit from continuing operators was $7 million, up from a loss of $18.4 million in 2014-15, which Mr George said was mostly due to higher prices for electricity and for large-scale renewable energy certificates (LGCs).
He pointed to much higher forward wholesale prices in South Australia and NSW for 2016-17, which would benefit Infigen’s plants that operate on the merchant market rather than being tied into a power sales contract. Futures prices in South Australia, where the market is more reliant on renewables and gas power since the closure of the last coal fired station, stand at $110 a megawatt hour for 2016-17, up 78 per cent from last year.
With prices also higher for LGCs, …”
The comment (which I have highlighted) linking higher forward prices to future good times for Infigen started me thinking …
Avid readers of WattClarity® will understand that I’ve posted a number of times in the past about the high degree of correlation (i.e. lack of diversity) across all wind farms currently operating in the NEM (right across NSW, VIC, SA and TAS) and the challenges this represents for organisations like the AEMO over various time horizons.
The question occurred to me:
To what extent does a high forward price in South Australia actually flow through to underlying share market value for a spot-market exposed, very wind-focused company like Infigen?
or, to put it another way,
To what extend does the apparent “wind correlation penalty” erode value that will be accruing to other spot-exposed generators (i.e. gas-fired ones*) in South Australia?
I invested a couple hours on Wednesday to investigate, before posting today.
Back on 4th July, I posted this analysis of some remarkable pricing patterns observed across all regions of the NEM through Q2 2016 – and followed up with this initial list of some of the contributing factors.
It is understandable that, viewing South Australia with a “rising tide floats all boats” mindset would lead one to conclude that this would be beneficial for all remaining generators in the state.
However, having been buried in the data on other occasions in the past, I understand that it’s often the case that simple conclusions end up being overly simplistic. I’ve posted this today to sum up my thinking, thus far, and pose the question – what are the significant things that I am missing?
I powered up NEM-Review and selected 3 groups of power stations very much the focus for this particular piece of analysis:
(a) Torrens A and Torrens B – the gas-fired plant operated by “big bad AGL”, who stand accused of price gouging in SA and other nasties (though not, notably, by Rod Sims at the ACCC)
(b) Northern – formerly operated by Alinta until it closed through Q2 as a result of a poor outlook, and (I understand) increasing difficulty accessing coal
(c) Lake Bonney 2 and 3 stations – two of the spot-exposed wind farms operated by Infigen in the South Australian region.
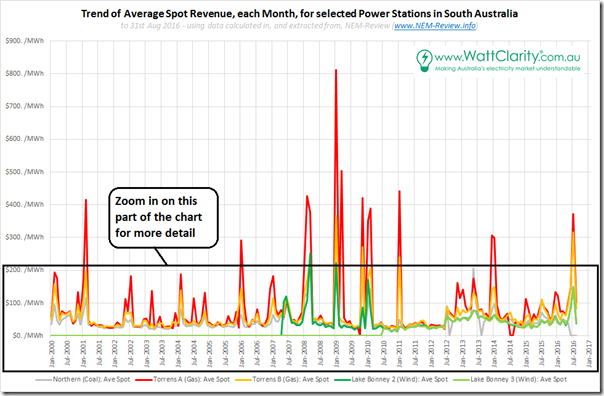
Using NEM-Review directly to produce trends of monthly station production, and also monthly estimated spot revenue, we then extracted the data to Excel to generate this trend of monthly average spot revenue for the stations for all months since January 2000:
We can see in this chart how volatile monthly average spot revenue has been for all 5 of the stations (but particularly Torrens A), which is one of the reasons why generators of all types typically like to hedge forward some percentage of their revenue, in order to provide more evening out of cash flows. At the moment, however, the 2 x Infigen Wind farms are apparently unhedged – which means some upside potential, but also some risk.
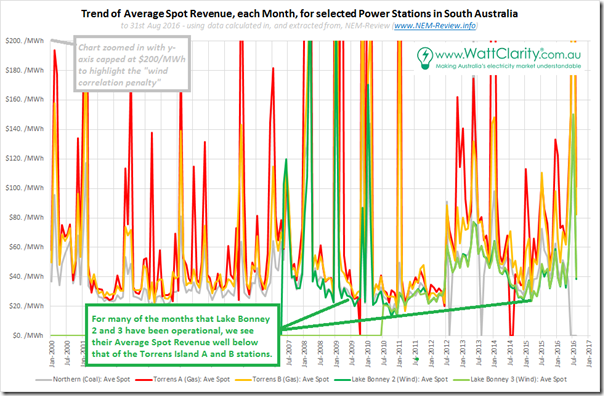
Zooming in to the bottom $200/MWh price range, we get a clearer view of the “wind correlation penalty” that Infigen (and all other wind farm operators in South Australia) are paying by virtue of the high degree of correlation of their outputs – particularly during overnight periods, where their collective bidding at below zero has sometimes driven the spot price below zero for periods (i.e. they, along with all other generations, have had to pay AEMO to keep running at that time):
This chart’s a fair bit noisier than is the first chart above – but a clear gap can be seen between the two green lines (for Lake Bonney) and the orange and red lines (for Torrens). Interestingly, we also see that Northern suffered the same type of penalty (compared to the Torrens plants) for many of the months that it was operational.
Especially on the volatile months, AGL has been able to use the dispatchability of the Torrens plant to earn much higher average revenues than Infigen with its wind-dependent Lake Bonney plant (i.e. wind farms have collectively shot themselves in the foot).
News that the Hornsdale Wind Farm (now contracted for all 3 stages, I believe) is being constructed as well is also not good news in terms of Infigen’s expected spot revenues, moving forwards. We’re presuming that Hornsdale will have a similar production profile, in a crowded region – which will compound the revenue gap (though we note that Hornsdale will be somewhat insured against this by virtue of the PPA structure in place with the ACT Government).
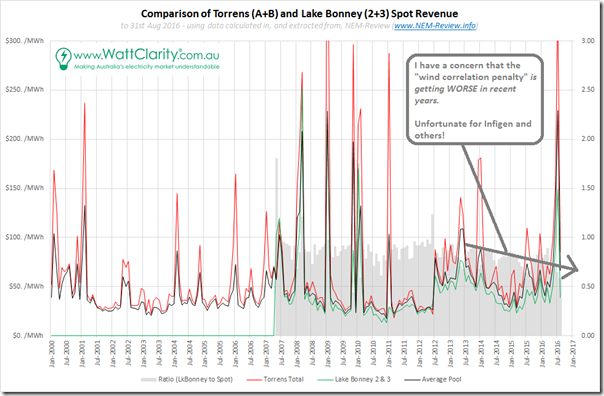
To make this clearer, I’ve generated the following chart that presents two sets of data:
1) In trend line, I’ve compared the average spot revenue for Torrens (A+B) with average spot revenue for Lake Bonney (2+3) – also including the average spot price for the region (in black) between the red and the green.
2) In trended grey bars, I have plotted the monthly ratio of Lake Bonney (2+3) average spot against average spot price (i.e. with a ratio below 1 highlighting how average spot revenue at Lake Bonney is lower than the “all hours” average spot price).
Unfortunately, to the naked eye it seems to align with what I had been suspecting – the “wind correlation penalty” is getting worse.
This penalty is effectively paid by Infigen (in revenue forfeited) because their output is highly correlated with that of other wind farms across South Australia. All these wind farms, operating in tandem, are driving collective returns lower because they are all operating at the same time, and incapable of running when the wind’s not blowing (without major investment in storage, for instance).
What this seems to mean is that, even if the base-load futures prices for South Australia are increasing on the ASX, Infigen may be at risk of increasingly missing out on the full share of the benefits as the wind farms have been effectively creating their own sub-market in South Australia increasingly divorced from the 24x7x365 nature of flat contract prices across the year.
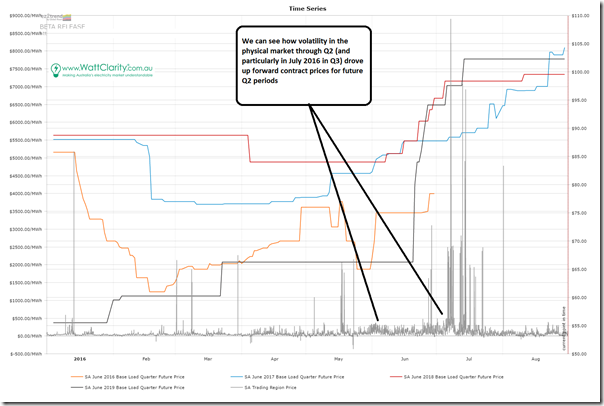
Finally, with respect to traded prices for futures contracts on the ASX – we take present this view (using a BETA of ez2trend) of how the increased volatility seen in SA prices beginning Q2 (and then flowing into an explosive July 2016 period) have flowed through into elevated base load contract prices for future years (i.e. partly because trader sentiment is a funny thing).
This was the source of the hope expressed by Infigen in the quotes attributed to them in the AFR article – however I’m not sure that the benefits will transfer. Indeed, as shown here, the separation between “Wind Average Spot Revenue” and “Average Spot Price – All Hours” has widened in recent months.
Am I missing something here?
Is this something that Infigen stockholders might want to be aware of?
Notes with respect to the above:
Footnote #1) LGC market benefits seem to be less ambiguous for Infigen
The AFR article goes on to talk about a higher price for LGCs.
To the extent that Infigen’s LGC production is not already contracted forward, then this would seem (to me) to be much more tightly correlated to increased revenue for the company (and hence presumably profit, given low cost of production).
Footnote #2) It’s not all wine and roses for the gas-fired generators
As the NEM-Review chart above highlights, spot revenues (and average spot revenues) have increased for Torrens in recent months.
However it’s not a one-way street for them (and gas-fired plant in general), either, given that the influx of wind into the SA region has had the effect of curtailing volumes of production (significantly for Torrens – chart not provided here to save space). This is important for plant with high capital cost.
Furthermore (unlike wind) these gas generators have non-negligible short-run marginal costs of generations. Many others have posted about how gas prices have surged at the Adelaide hub of the STTM (and we understand that costs for transport have also escalated). These factors will have combined to moderate the profitability of the higher spot revenues received (beyond whatever hedges have been in place) for gas-fired generators.


Thanks very much for the analysis. My intuitive guess is that this correlation penalty is going to get worse as more Wind is added in Victoria as well since there will be less opportunities to export. My other intuition is that wind generators will increasingly suffer as residential solar + batteries takes off.
Fossil fuel generators have the capacity to tailor their production, at least to some degree, in accordance with predictive weather patterns but Wind generators will just keep competing with each other. Their only option will be substantial investment in their own storage technology (whatever that may be) but it’s not clear the CAPEX would be worth it.
It seems that the ACT electricity consumers are taking on all the risk of the PPAs signed with Horesdale Wind Farm, set to provide LGCs to the ACT government as an offset to the non-renewable supply fed into the ACT. The 1200GWh will represent about 40% of the ACTs electricity use. In order to lift the nominal renewable use to 100% the ACT government will surrender these LGCs.
John,
Your analysis of the ACT wind subsidy is spot on (if you can excuse the pun). Minister Corbell is spinning the line that ACT consumers are protected by a rising average spot price which closes the gap in the contract for difference. However the wind outputed weighted average spot price is declining (if it wasn’t then merit order effect would be another fantasy). ACT consumers will pay a much higher subsidy to SA wind farms than the government is predicting.
The media in the ACT is accepting the Government’s propaganda. Several op/eds have praised the canny Minister’s scheme.
How much of this wind correlation penalty arose from SA becoming a net importer to a net exporter of electricity ? The SA market appears to go through 4 stages prices depending on the electricity deficit or excess.
1. When demand exceeds the inter-connector import limit, price is determined by the SA bid stack.
2. When demand is below the inter-connector import limit, and SA is a net importer, the price is ~$10/MWh ABOVE the Vic price. The $10/MWh is probably a margin made by SA Power Networks.
3. When excess is below the inter-connector import limit, and SA is a net exporter, the price is ~$10/MWh BELOW the Vic price.
4. When net supply exceeds the inter-connector export limit, price is determined by the SA bid stack, and is generally negative.
So at most times, the Vic price provides at floor to the SA price, but there is a $20/MWh price difference between net import and net export.
Since the post was prepared, Hazelwood has closed and Vic prices are determined by the marginal cost of gas-fired electricity, first at through Mortlake then at Newport, both of which are more flexible than was Hazelwood. Furthermore, the inter-connector capacity has been increased. Previously during times of high wind production, Hazelwood would keep up full production, leading to a depression in prices from the combined SA and Vic wind production. On Sunday 9 April was the first instance of high wind and low demand in the post-Hazelwood market. Loy Yang A reduced its production and provided stability services, while Loy Yang B and Yallourn W continued unabated, but prices subsided only a little. So these market changes are likely to reduce the problems of the wind correlation, at least until more wind supply is added. Now we need more balancing solar to supply the market under anticyclonic conditions (high pressure cells).
At times when the spot price in SA is zero, is there no incentive for VIC to import this very cheap energy? Would this not raise the price in SA materially? Or does the wind supply in SA exceed the export capacity to VIC in these circumstances?
You might find the animation in this linked post of some value in understanding some of the dynamics:
https://wattclarity.com.au/2015/09/yin-and-yang-of-wind-in-the-south-australian-region-of-the-national-electricity-market/