At the turn of the quarter, I posted this analysis of some truly remarkable prices we’d been observing as Q2 2016 unfolded.
Since that time, the context provided on WattClarity has been working its way into commentary provided by various other parties – both new media and old media. Unfortunately, some clumsy wording in a number of places has led to me fielding a number of questions from people who’d inferred (reading 2nd hand) that my analysis had either:
(i) pointed the finger at wind – as in “wind is to blame”; or
(ii) not pointed the finger at wind
depending on the reader’s own perspective.
This has, unfortunately, been a bit of a distraction given everything we have going in our “day job” at present.
(A) Reiterating our focus
Hence I reiterate 3 points:
A1) We see the energy transition* as much broader than a specific focus on de-carbonising the energy sector by whatever the method;
As I’ve noted before, the “energy transition” encapsulates responses to concerns about climate change concerns, rapid technology advancement in terms of supply options and also in terms of consumption and management of the grid, and raised customer awareness and price responsiveness (at least for some).
A2) In terms of the current debate* with respect to renewables targets, we strive to remain technology agnostic (or, to state it another way, we’re not at either end of the “emotion-o-meter”);
I call it a “debate” but in truth have sadly been seeing it more and more as a pre-schooler shouting match between different groups of kids in the playground that all contributed to the mess they are confronted with, but devolve to inane name calling that achieves no real resolution:
“He started it”,
“No she did”,
“Did not”,
“Did too”,
oscillating to crescendo and drowning out the more reasoned perspectives.All very disappointing for the broader energy supply industry – which is, at the same time, all of the following:
(i) Essential service at home and at work (particularly in places such as hospitals etc);
(ii) Major driver of our economy (some decoupling has begun, but it remains a very significant driver) and hence a major indirect employer, and contributor to investment returns etc…; and
(iii) Significant direct employer.Surely we can do better than this!
For instance, the AEMC has recently started a Review of market frameworks for power system security. I do hope that we can see some more reasoned perspectives from all involved with this.
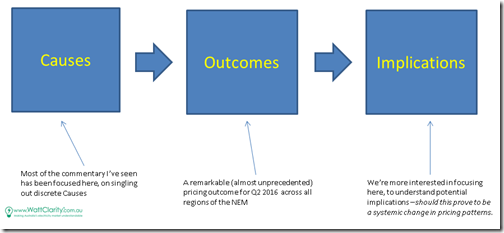
A3) We’re much more interested in thinking through the implications of the change in pricing patterns, rather than through the causal factors. This would be especially the case if these changes to pricing patterns do prove to be systemic (as some indicators do point to being the case):
It’s in this spirit that I posted last week about potential challenges for demand response if these pricing patterns continue into the future. In reading that article please keep in mind that this was written with respect to our experience in supporting a particular form of demand response at a number of major industrial energy users across the NEM.
A number of major energy users in Tasmania experienced a rather unwanted form of demand response through the first half of the year which must be weighing on their minds when sizing up any major investment decisions in future.
Despite how we’re much keener to think through potential “Implications”, circumstances do seem to keep trying to drag us back into that rabbit hole that is “Causes” (or “smoking guns” to some) ….
B) Some things I’d think about, if I jumped into the rabbit hole
For the benefit of those who’ve contacted me one-on-one with questions, here’s a starting list of things I’d puzzle through (keeping in mind the question of “Implications?” in all of this)…
B1) Systemic issues with EVERY fuel type currently used in the NEM
Let’s start with the basics – no fuel type (or generation technology) is perfect.
A couple years ago I posted these comments about attempts to privatise profits (whilst socialising costs) with respect to wholesale market supply. These challenges remain.
More recently I’ve become increasingly aware that all of the major fuel types used in supplying electricity in the NEM faces some their own discrete, systemic, significant challenges, moving forwards.
B1a) Systemic (global) issue with Coal
Barring some major cost reductions in the technology of carbon capture and storage, it seems pretty clear that coal is in terminal decline – with the only question being how many years (how many decades) this will play out over. A new coal-fired power station in the context of the NEM would not be investable.
We still have a sizeable fleet of old plant across the east coast that still provides the lion’s share of electricity supplies for the NEM (see today’s current share here). In the absence of other influences, these assets could be a little like “grandfather’s axe” and be progressively refurbished to continue supplying power decades into the future.
However economic and social pressures being brought to bear are changing the mix – as a result of which we’re seeing the older plants progressively close – like Redbank {though there might be a repowering in the works?}, Munmorah, Wallerawang, Anglesea and recently Northern in South Australia.
(i) Given the seeming inevitability of the end of coal as a power generation source as the existing fleet progressively switch off, my “clapped out old car” analogy talks to the risks of systemic higher forced outage rates – leading to higher risk of coincident forced outage.
(ii) Given the ongoing oversupply of capacity in the NEM, it is probable (we have not checked, so this is speculation at this point) that generators won’t feel as pressured in relation to outage planning for routine maintenance now, compared to days of yesteryear.
Back when supply/demand was tight, and demand growing reliably, generation companies focused on shaving outage times and reducing risk of schedule overruns. Given the price and volume issues they have been facing more generally in more recent times, where’s the incentive to work 24×7 through outages over a few high-stress weeks in order to ensure the plant is back for a certain date? The downside of a slippage seems to have been reduced.
It’s certainly been noted elsewhere that there have been coal plant in VIC, NSW and QLD offline during the Q2 period, and more recently in Q3 – hence reducing available capacity.
(iii) These systemic issues with coal fired power are not made any easier by the types of local disagreements unfolding between unions and management at Loy Yang A power station (reported here by the AFR, the Australian, the ABC (and the counterparties AGL and CFMEU (though that one’s not recent)). Taking the above into account, a 21-21.5% pay rise offer over 4 years that is still unacceptable to the workplace at a facility that is in structural decline does seem a bit odd.
All factors to consider – with respect to what’s been happening more recently, but also in terms of what the implications are for the future.
B1b) Systemic issue with Gas
Gas-fired generation has been often talked about in recent weeks.
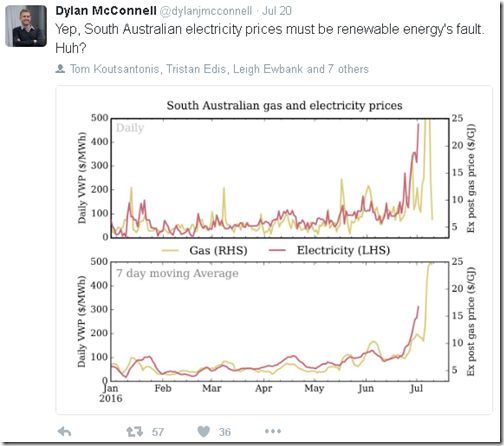
Keeping in mind that the following image was tweeted particularly with reference to volatile electricity/gas prices during July, and I’m ostensibly posting about what happened in Q2, it certainly sums up well how the electricity and gas markets are now joined-at-the-hip:
What’s more, as an industry we have made the correlation more significant, in a bad way (from the perspective of the electricity market) by, simultaneously:
(i) linking domestic gas to the export market;
(ii) massively ramping up gas demand (because of export); whilst at the same time
(iii) applying the handbrake on the supply side, by imposing and extending moratoriums on new gas development in a number of states.
(iv) Coupled with that the fact that we had 3 separate LNG construction projects, all running in parallel but with pretty much zero collaboration – probably contributing to massive blow-out in construction costs, such that not even Santos and Origin shareholders are benefiting from the exports currently.
It’s plain to see that the broader gas industry has not covered itself in roses.More directly in the electricity market, we’ve transitioned (over recent years) from known quantities of gas on low-price (e.g. take-or-pay) ramp up gas arrangement towards very uncertainly timed & peaky gas volumes (because of where it sits in the merit order), which has added to the major escalation of gas prices (i.e. not just prices at the hub, but also factoring in transportation charges).
If everyone wants gas at the same time, but does not have the certainty to contract for it in advance, it’s no wonder that gas prices have been bouncing around as much as they have of late – which feeds into electricity prices.
Where to from here?
B1c) Systemic issue with Hydro (and Water, more broadly)
Nor is hydro (and water, more generally) looking that flash.
This year we have seen the Tasmanian debacle brought about, in no small part, because of climate-challenged rainfall levels affecting all of Tassie’s hydro storages. This was a major contributor to the outcomes seen in Q2 2016 in Tasmania.
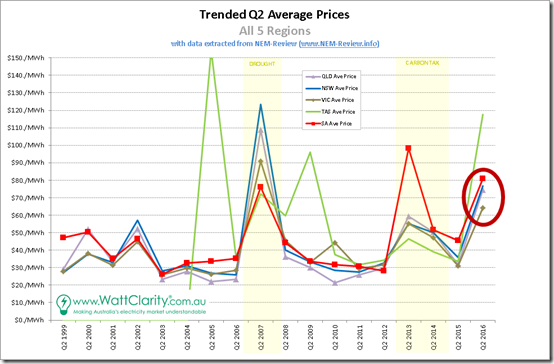
Thinking more broadly, however, it was only back in 2007 that we saw a NEM-wide calamity, with respect to prices, flowing from a NEM-wide drought that afflicted both the main hydro systems supporting the NEM and several water storages supporting thermal plant. Here’s that summary chart, again:
Clearly, water is a key driver of electricity prices – and it’s one that is systemically challenged.
As we move into a more climate-challenged world in future, the theory is our rainfall patterns will become more and more patchy (I believe?), which implies strongly that what we’ve seen in 2007 (NEM-wide) and 2016 (NEM-wide) will become more frequent.
On top of that, it seems that some are thinking that we can double down on the use of our existing hydro reservoirs as giant batteries for when the wind’s not blowing and the sun’s not shining – without any real consideration (or modelling, to my knowledge) of:
(i) The huge difference in power requirements between existing capacity and demand; and
(ii) Transmission limitations in getting it to market; and
(iii) The differences in cycle times between potential depletion (if filling the gap in lulls in the wind and solar) and replenishment (mainly from rainfall, given very little is pumped storage); and
(iv) The very limited number of actors involved (from the perspective of competitive tension).I know that people have done preliminary work (here’s the Arup-MEI one from 2014, but I believe there are others) on the possibility of numerous, small, distributed, low-head pumped hydro plant scattered across the NEM, and I look with interest at projects such as what Genex are proposing.
Surely we should be doing more, collectively, to work through this challenge?
B1d) Systemic issues with Wind
The systemic alignment of gas supplies (in terms of both commodity price risk and also in terms of volume risk – which flows through to transport pricing through the nominations process) with electricity has been a significant driver of the outcomes seen during Q2 2016.
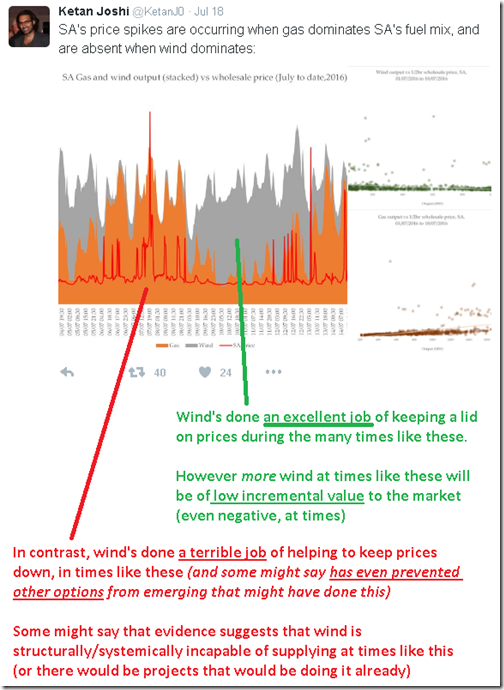
However there’s an equally problematic issue with the systemic alignment of wind supplies (or lack of wind diversity), across all existing wind farms (not just those in South Australia). This issue also played a role in outcomes seen through Q2, and ongoing into Q3.
I was encouraged to see David Leitch post about several factors (including the lack of diversity) in RenewEconomy last week. I might have missed others, but this seemed to be the first significant article on that site tackling this issue.
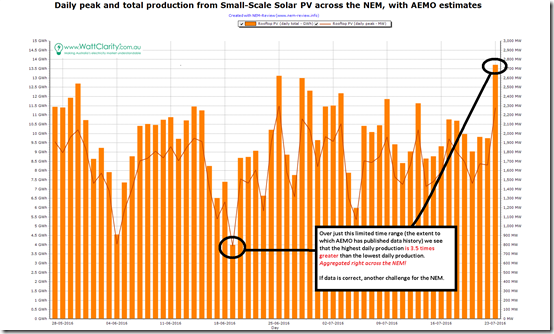
We’ve been puzzling about lack of diversity in wind product NEM-wide for a number of years, including this look at how wind farms are collectively shooting themselves in the foot as result of this strong correlation with each other. I’ve seen images like the following doing the rounds on twitter in recent weeks, so I’ve taken one and (with apologies to the original author) have annotated to illustrate a major challenge for the NEM, moving forwards…
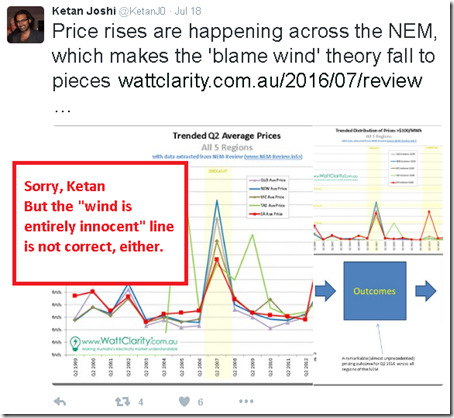
To sum up – wind is certainly not entirely to blame (as a number seem to be insinuating in their commentary – and certainly in their headlines) for what’s been happening in terms of pricing outcomes through Q2, but nor is it entirely innocent either (as another group had seemed to be implying).
It would be a (very) great thing for the NEM if wind outputs for large-scale wind plant to be built in the northern part of the NEM in the coming years were to be significantly anti-correlated to the stuff in the southern part.
Periodically I have asked a number of project proponents if they could lend me some time-series wind incidence data over past years for their sites in order that I could perform an independent review and post what I find on WattClarity. However no-one has been forthcoming, yet. Hence I am still in the dark on that one – as is the rest of the NEM, I believe?
If any of our readers are developing a project in QLD or Northern NSW and could share this data with me, I would extend that invitation to you. Please call me on +61 7 3368 4064 or just email it through.
Let’s assume, for a moment, that’s there’s an excellent degree of anti-correlation (i.e. not just independence, but negative correlation) between wind farms in the north and wind farms in the south – this would have the effect of smoothing out wind production NEM-wide, which would be an excellent thing.
(i) Unfortunately the LGC is an incentive independent of location, and independent of any price-related-temporal setting.
(ii) Does this imply that this method is not a sustainable solution for encouraging the development of the “right” projects (by that measure)?
(iii) The fact that no projects have been developed in QLD save for the tiny Windy Hill project over how-many-years of the MRET existence is a pretty clear indication that something’s gotta change if we’re going to get to the large percentages of renewables talked about in some targets.B1e) Systemic issue with Solar PV?
Solar power is a relative newcomer to the NEM – and, in truth, the growth in buzz has preceded a growth in its real impact by a number of years. However it’s continuing to grow, and looks set to continue that trajectory.
One good point to note is that, at least for now, the NIMBY concerns that seem to have beset wind, gas production, transmission development, possible nuclear and pretty much anything else has not yet beset small-scale solar PV (I do recall reading some NIMBY type concerns relating to early large-scale solar plant around Canberra).
In terms of systemic challenges to deal with in relation to solar PV, there’s the obvious case that it’s all correlated towards the middle of the day (NEM-wide). This means the same sort of challenge as I have sketched with wind above – in that there’s declining value from incrementally more solar PV in the energy market as the “duck curve” takes hold .
What was far more perplexing to me, at least from the very cursory review I posted here, is that there appears to be an apparent alignment of something (massive cloud cover?) suppressing solar output across the-whole-NEM on certain days – we see in the chart in the article above that the 4th June (in particular) shows low levels of output across QLD, NSW and VIC, with only SA solar PV generation levels bucking the trend (and Tassie being too small to really see, in this case).
Given a number of weeks have passed since that article, I powered up NEM-Review to provide this updated comparison:
As can be seen, aggregate output over different days varies as much as 3.5 times, according to the data! That’s a stunning variability (at least to me) considering that the data is supposed to represent rooftop solar NEM-wide!
Now, as I noted in the original article, this outcome might have resulted from inaccurate (somewhat independent) estimation methods used by both the APVI and by AEMO:
(i) At the very least, this illustrated the urgency at which the NEM requires much better data on what our growing fleet of small-scale rooftop solar PV is performing, right across the NEM. The AEMO is investing heavily in this – what can we do, as an industry, to speed up the process and make it work better?
(ii) If it turns out to be that there is actually a problem in that some days will see output at a small fraction of what would normally be expected NEM-wide, then it does make me wonder about the depth to which these types of variability’s have been modelled in the energy transition studies frequently quoted as “proving” one particular future scenario. As I have said before – every model’s just a model, it’s not reality (though some might be useful)!
It’s probably not as relevant for Q2 2016 price outcomes (with the contribution being relatively small at this point) but it will be something to watch in future.
One other thing to watch (not so relevant to Q2 2016 but moreso for the longer term) will be the rate of decline in performance of the widely distributed (and variously aged) rooftop solar PV across the country. I expect that most of it won’t be proactively maintained, with a share of home owners only finding out that their system is failed when their energy bill changes significantly in a given billing period.
Given the dispersed nature, and (I assume) the lack of intensive monitoring, my sense is that these generation assets will perform differently than the electricity industry has become accustomed to over recent decades.
(i) Whereas in the past we’ve had a few big plant that have operated under the oversight of professional engineers who’ve utilised plenty of instrumentation, perhaps we’re transitioning to a world with less instrumentation and intensive monitoring.
(ii) In planning processes, such as the AEMO Statement of Opportunity, does this mean the need to focus much more on the supply side of the equation – in terms of how “existing capacity” might perform a few years out into the future. Does some kind of decay rate need to be assumed (with the rate progressively tuned to what’s actually observed in terms of real outputs from older systems)?
This is another technical & organisational challenge that surely can be solved – perhaps it’s part of a new role for our reborn energy retailer in this transitioned energy sector?
B1f) What about other supply technologies not deployed in the NEM currently?
What about them? … I mean, really, what about them?
Each have their own advocates – but they are not here. History would suggest that, unless something significant changes, they probably won’t be deployed enmasse in any reasonable time period.
To sum up, we have the majority of electricity supply still provided by coal-fired generation (a technology in terminal decline), with all of the other supply options currently being used facing their own individual, systemic (NEM-wide) challenges.
Not an environment for “easy” problem solving, especially in such a politically charged (toxic?) environment at present.
B2) Lack of Competition
I’m running out of time today – but just wanted to touch on a couple more contributing factors that have been mentioned in recent weeks.
Particularly with respect to South Australia, “lack of competition” has been cited as a contributing factor.
Unfortunately South Australia, being a small region in relation to electricity consumption, faces a fundamentally harder task of sustaining sufficient competition than do the QLD, NSW and VIC regions. In similarly sized Tasmania, for instance, the “market” has evolved to a form of regulated market with a single wholesale supplier setting prices under a form of regulation that some of our readers will be better placed to explain succinctly.
B2a) Competition within the South Australian region – in the good times
If I had more time, I would look in more detail – but my sense is that during the good times the influx of wind generation has created an environment where there are plenty of different participants all independently supplying the market (i.e. independent of the technology they choose).
What’s particularly interesting is that many of the wind farm projects are operated by companies that are:
(i) Small (in terms of both MW capacity and MWh supplied); and
(ii) Independent from each other; and
(iii) Somewhat independent from the companies operating thermal portfolios in the region.
Hence this does point to a good competitive market outcome.I did previously note how AGL Energy does have a large share of wind production, and I wonder what effect (if any) this has on portfolio management between their gas and wind assets in the state?
To sum up, in the “good times”, there’s a plentiful mix of competitors in the state.
B2b) Competition within the South Australian region – in the not-so-good times
However, in the “not-so-good” times, the outcome is such that it can be thought of as deriving from two sequential events:
(i) When the wind stops, it has the same effect (in terms of setting the price) as if all the wind farms in the state collectively bid their capacity above the Market Price Cap, so as not to be dispatched (even though they are operated by many different participants); and
(ii) Unfortunately the situation is compounded by having gas-fired plant bidding their aggregate capacity higher, as well.
Hence the two systemic factors (lack of wind diversity + gas/electricity linkage) combine to mean that the plentiful competitors there in the “good” times disappear during the “not so good” times.
B2c) Inter-regional supplies
Clearly with the situation in South Australia at present, a larger interconnector allowing more imports from Victoria at times when the wind’s not been blowing would have had a significant effect on suppressing the price on some occasions (though noting that the price patterns observed were NEM-wide, and also that increased export capacity could also have the effect of lifting prices from current very low levels when the wind’s blowing).
There seem to be essentially two main pieces of the puzzle to think through with respect to interconnections:
(i) Firstly, it will be important to ascertain what the steady-state interconnection capacity should be* in order to achieve a competitive market outcome in South Australia (not withstanding the constraints imposed on what can be classed as a benefit under the “Market Benefits Test” in the RIT-T).
* note that these considerations would run in parallel (but won’t be identical) to considerations of what the capacity should be from a security of supply standpoint, given the lower amount of high inertia capacity now operating in South Australia, and the possibility that this might decline further in future years with other thermal plant closure.
(ii) Secondly, it will be necessary to think through how to sequence the implementation of upgrades (given the painful irony that some of the price outcomes seen in SA have resulted from short-term work necessary to deliver the upgrade that will deliver long-term benefits).
Given the growing number of significant, independently-varying parameters that the TNSPs need to consider in planning high-Capex augmentation works in order to minimise the market impact of transmission congestion (whilst managing within their Capex budget), their job is getting progressively more complicated.
I’d like to have more time to think through this one, as well…
B3) Market reform
Coupled with the above, there’s been growing calls for “reform” (though I suspect that catch-all means different things to different people).
Amongst those making the call are the Grattan Institute, several politicians have made the call, and last week I noted that the Clean Energy Council released this note calling for an “honest discussion about energy in South Australia”, linked to this short report that analysed some of the points raised above.
I’ve run out of time to think more about this today and need to climb back up out of the rabbit hole…
I attended the Energy Networks 2016 conference in Adelaide back in May and was pleasantly surprised to see that the overall mood of the audience was a lot more positive than in the past events I had been at. My sense was there is a growing collective realisation amongst the network businesses that:
1) they had been part of the problem (in getting us to the current position) – but that
2) they could also be part of the solution (though this would take a mindset shift, which might be harder for some than for others).
The work that the Energy Networks Association has been doing with the CSIRO in describing 4 different (and each plausible) scenarios for this industry transformation has helped to facilitate a more mature discussion about the future, in my view. Obviously there’s a way to go on this journey.
This week I will be at the 2016 Clean Energy Summit in Sydney.
In the light of all that’s gone on in the current weeks, I would hope to see a similar progression from another sector of this broad industry where (like the network businesses):
1) the clean energy sector has contributed to the problem – but that
2) it can be a large part of a mature and sustainable solution.
No technology is perfect. We’ve all contributed to the problem.
With each of the main ones used in the NEM, there appears to be separate (yet interrelated) significant systemic challenges. Each are serious challenges that will need to be addressed – the problems are all not solved, but they are solvable.
A mature discussion of the energy transition will incorporate a reasoned discussion about the technical and commercial aspects of strengths and weaknesses of all of these.


With regards to wind correlation across the distances you cite, I think Dr Morgan’s analysis is as independent and thorough as we might get right now.
https://bravenewclimate.com/2015/11/08/the-capacity-factor-of-wind/
Surprisingly good analysis.
He states the cost of curtailment as fact though, without any supporting information.
Curtailing a few % of potential production makes very little difference to lifetime cost of energy. See the maximum generation periods in winter and how little duration there is.
‘Innocence’ and ‘guilt’ are such odd concepts, when you think about it – but they’ve been created for this issue due entirely for the need for a collection of media outlets to campaign in a way that protects incumbent fossil fuel interests.
I try to think about the logic of the claims. If we had a system of all gas, and no wind, the problem would still exist. If we had a system of some wind and some gas, the problem exists.
So, wind is necessary in the emergence of this phenomenon – as you point out, periods of low wind result in the dominance of gas, which is expensive, and so price goes up. But gas’s contribution to the issue – namely, high cost, is both necessary and sufficient – if the fantasies came true and we took an axe to any generation facility that doesn’t rely solely on pollution-intensive fuels, we wouldn’t be living in a wonderful land of low prices and bountiful supply (and emissions would be high, which is a bad thing).
Hence, my tweet pointing out that laying the blame solely on a [necessary but insufficient] factor, and entirely ignoring the [necessary and sufficient] factor is wrong.
As you say, there’s no getting around the fact that there are times when wind output is low across the entire South Australian fleet. As you also say, gas prices are high. So, the most constructive way forward would be to openly and honestly deal with *both* of these components, in a way that doesn’t mean a return to carbon intensive fuels, simply because we can’t be bothered solving this problem.
I guess it’s worth pointing something else out – spreading misinformation about the national electricity market is a direct contributor to problems that can arise out of the system, as decision-makers are influenced by this information.
In old media, statements are declarative, no evidence is ever included, and challenges occur over the course of days, long after the original declarations are assumed to be correct. In new media, even if misinformation springs up, at least these can be challenged or criticised (as you’ve done with my tweets above).
A major factor in the flurry of falsehoods that have emerged is traditional media outlets failing to understand the nuances of the system they’re talking about. The end result will almost certainly be a worsening of the problems they’re concerned about, with the added effect of destroying a new Australian industry. I feel that this impact is under-discussed – everyone just seems to shrug and accept it.