With a high benchmark already set this November for both New South Wales and NEM-wide demand, and as we head into summer during one of the strongest El Nino events in recorded history, it begs the question:
What will peak demand look like for Summer 2015-16?
I set out on a mission to see how well one can forecast peak demand based on how warm or cool the entire summer is expected to be. More specifically, I wanted to find out if the average temperature over several summer months could predict the magnitude of that same summer’s hottest days. The theory being: If it could, we could then predict this summer’s peak demand by applying MetraWeather’s seasonal forecast to the observed correlation. If we can extract the most likely hottest temperature that we expect to occur in each major city, then that gets us a large step closer to predicting state-by-state peak demand.
First up, not all days are equal in the National Electricity Market. Hot temperatures will never illicit the same response in demand during weekends and holidays as they do during weekdays. To get around this, I decided to try and forecast the average of the Top 3 hottest days per location, as this proved the best benchmark for quickly quantifying the hottest “non-holiday weekday”.
Secondly, to quantify the “average summer temperature”, I used every multi-month combination to establish which time period best correlated to the Top 3 hottest days per location. For example, locations along eastern Australia tended to lean toward the November-to-February average as the best predictor, whereas southern locations leaned toward time periods that centred within Q1, reflecting the tendency for extreme heat to fall later in the year for both Melbourne and Adelaide.
Let’s see what we have:
QUEENSLAND
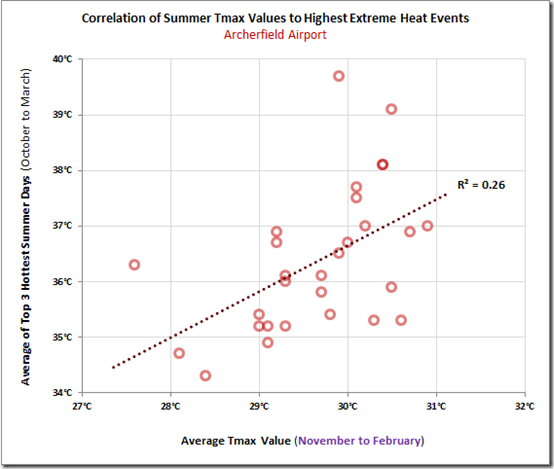
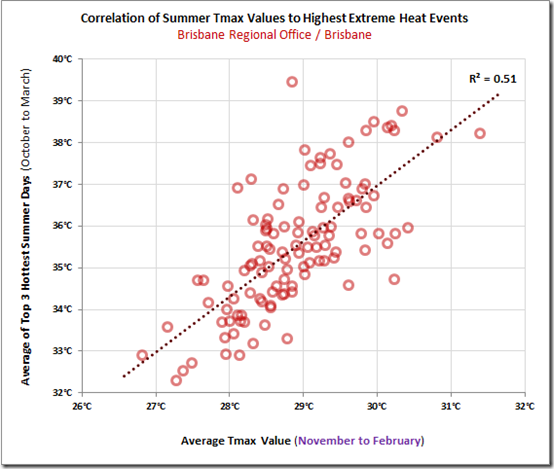
The key location used by MetraWeather for Queensland is Archerfield Airport, which sits near the approximate centre of Brisbane’s population distribution. However, Brisbane CBD proved a better predictor for extreme heat events. This is most likely due to the location’s much longer time series.
The time period that best correlates to the Top 3 hottest summer days for South East Queensland is November to February. For the longer dataset of Brisbane CBD, a pattern appears such that for every degree warmer the November-to-February time period is, the hottest day is expected to be 1.3 degrees warmer.
Applying MetraWeather’s latest seasonal forecast, we get a corresponding value of about 37C as the most likely average of this summer’s Top 3 heat events for both Archerfield and Brisbane CBD. In other words, the top “non-holiday weekday” temperature is most likely to be about 37 degrees across Brisbane, about a degree higher than average. It should also be implied that this scenario occurs similarly to other 37-degree events, where a sea-breeze would be late to occur.
NEW SOUTH WALES
If there’s any city looking to bear the brunt of heat waves this year, it is Sydney. While Brisbane is not far behind in this heat forecast, it is Sydney that has been more persistently targeted by seasonal weather models for above-normal temperatures. Recent seasonal forecasts have backed off a bit from the expectations of a very hot summer for Sydney and Brisbane, but remain firmly on the warm side of the spectrum.
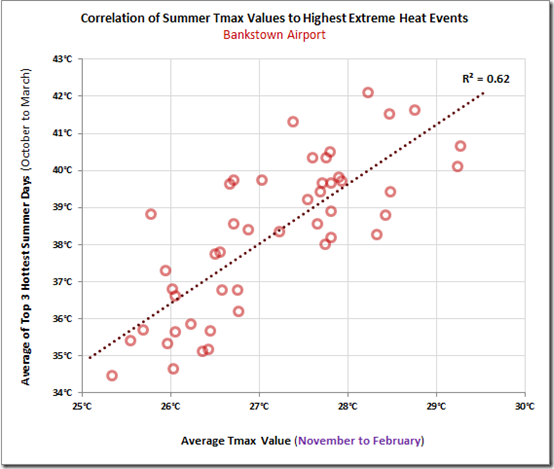
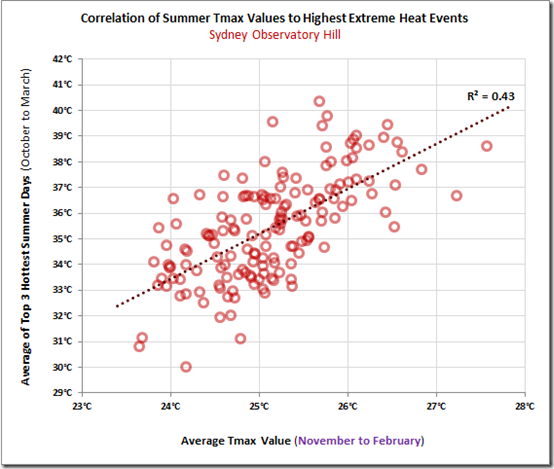
Using the same correlation method, this time using Bankstown and Observatory Hill, we can extract a Top 3 extreme heat forecast of 40C and 38C respectively. In other words, we can likely expect at least one more extreme heat day for Sydney of near-equal magnitude to the November 20 event, later on in the summer.
Using a dataset that spans as far back as the 1850s does bring up the valid argument of how relevant these forecasts are when applying it to 21st century summers. However, this relationship would only break down if the correlation between the overall summer average and the magnitude of extreme heat days have altered over the last 150 years in Australia. I will leave this as an open-ended thought.
VICTORIA
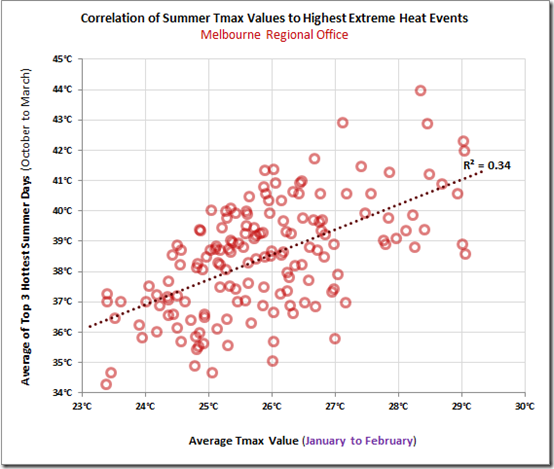
Melbourne is not expected to be much above or below normal this summer when compared to the standard 30-year climatology of 1981-2010. However, when compared to the full 160-year record of Melbourne Regional Office, the summer forecast is an above-normal one. Unlike Brisbane and Sydney, the correlation is highest when defining summer exclusively as January to February.
The most likely peak temperature appears to be about 39 or 40 degrees, but this is for the now-defunct Regional Office site. In the two summers where Melbourne Regional Office and Melbourne Olympic Park were running concurrently, it was clear that the new Olympic Park site is often a half degree to full degree cooler than its Regional Office counterpart during extreme heat events. Thus, it is expected that peak demand in Victoria is best based on Melbourne Olympic Park reaching 39C (during a non-holiday weekday).
SOUTH AUSTRALIA
It can be argued that it is not as safe an assumption to predict peak demand in South Australia based solely on extreme heat, as renewable energy’s role is much larger than in any other state. However, the correlation between the hot summers and the hottest individual days is fairly strong.
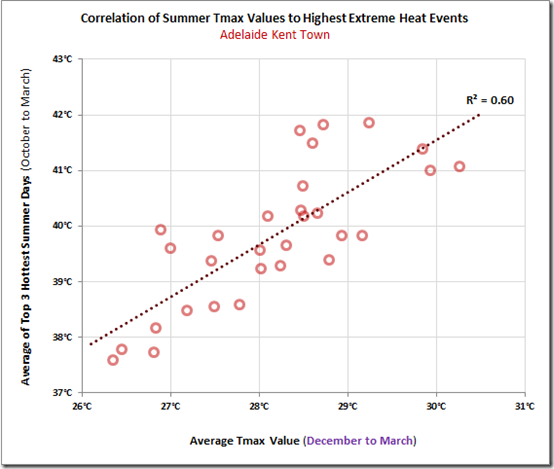
Adelaide’s definition of “summer” seems best when using December to March, as this gives the highest correlation to extreme heat (and thus, to an extent, peak demand).
Similar to Melbourne, the likelihood of this summer’s overall temperatures being above average is only slightly more than them being below average. The latest MetraWeather seasonal forecast for Adelaide Kent Town would translate to a 40-degree day as the most likely hottest day, and thus the best Tmax value to assume when translating temperatures into a peak demand forecast.
CONCLUSION
This quick study into the ability to predict the hottest days, simply from looking at how hot the summer is expected to be overall, shows that while it’s not a strong correlation in most instances, it is significant enough to appreciate.
From a probabilistic standpoint, the net still needs to be cast wide in order to catch the full range of possible outcomes. But about half of the climatological range can be either eliminated or significantly reduced in likelihood.
And when it comes to predicting peak demand (and winning a BBQ!), that ain’t half bad.
Editor’s Note
Note that Rob previously published this review of weather seen through summer 2014-15 for WattClarity.
Entries close this Friday (27th November) for your own chance to win one of 7 BBQs in WattClarity’s Peak Demand Forecaster Competition.
About our Guest Author
| Rob Davis is a Meteorologist who has worked with MetraWeather since December 2013 – and prior to that for many years with The Weather Network.You can find Rob on LinkedIn here.
MetraWeather is a world leader in the supply of weather data visualisation and automated prediction technology solutions to energy, broadcasting, retail and other industry clients around the globe. MetraWeather works with clients throughout the energy supply chain, providing specialised software, dependable high-quality forecasts and observational data designed to give customers the essential insights necessary for them to make timely and effective business and trading decisions. |



Be the first to comment on "A meteorologist’s prognosis for peak demand for summer 2015-16"