One of our readers reminded us, today, of something interesting that happened yesterday evening…
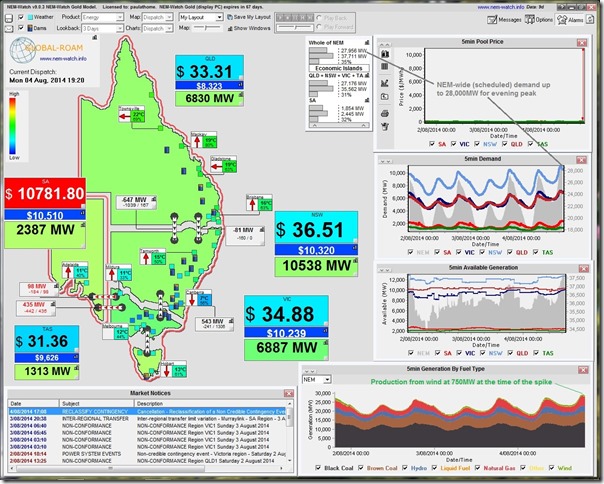
Our NEM-Watch package alerted us to a price spike in South Australia at 19:20 (NEM time) yesterday:
(a) The SMS alerts configured in NEM-Watch Platinum buzzed at the time to let us know; and
(b) The display copy of NEM-Watch we have running 24x7x365 in the office captured the event at the time and emailed the following snapshot to us, for use in reports (and posts like these):
Prompted by one of our readers, we powered up ez2view today, and re-wound in “Time Travel” mode, to take a closer look at the South Australian region yesterday evening
In Time Travel, ez2view highlights the market conditions that were evident at the time you’re pointing the display at – including what the AEMO had forecast in predispatch at the time. In ez2view, as in NEM-Watch, all times below are NEM time (Brisbane time for those uninitiated in the language of the NEM).
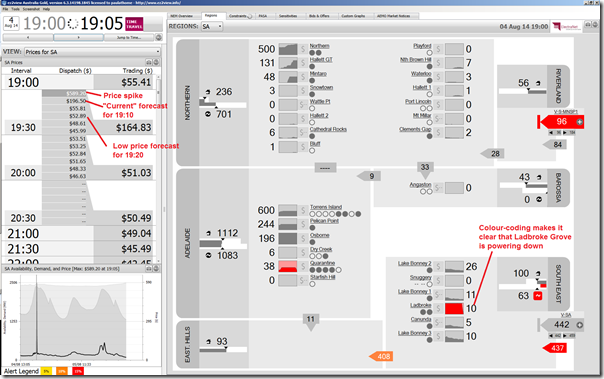
19:05 on Monday 4th August
In the first snapshot from the start of the trading period, we see that the South Australian price already jumped to $589.20/MWh (from a dispatch price of only $59.20/MWh at 19:00 – the end of the previous trading period):
The numbers shown next to each station indicate the metered output for each station. In the snapshot above, you’ll note the low output from all SA wind farms (virtually zero in the north, and a low (and declining) amount of wind in the south-east.
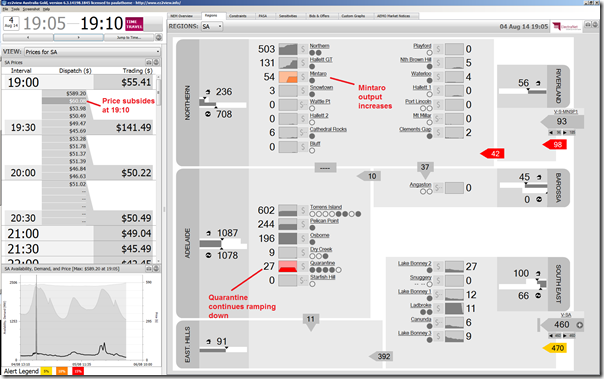
19:10 – five minutes later
Five minutes later, we see the $190 price threatened for 19:10 evaporate:
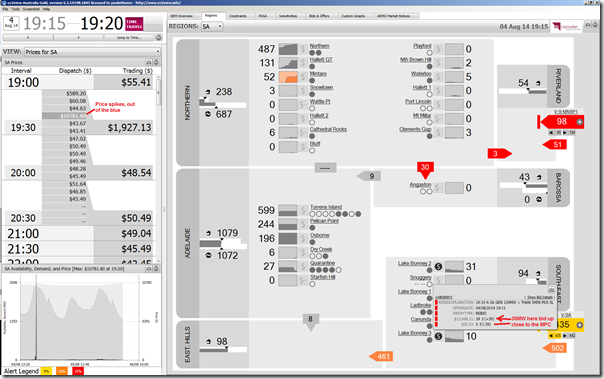
19:15 – rebidding appears
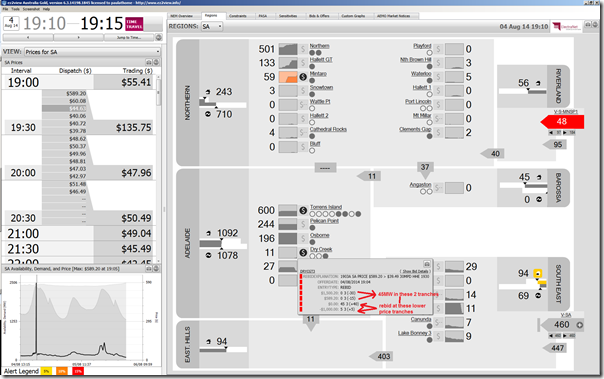
At 19:15, five minutes prior to the spike, we see the first of the rebidding that would feature in the half-hour.
Mousing-over each “$” symbol in ez2view enables the user to see more about how each bid has changed for the dispatch interval chosen. I’ve chosen to highlight the case for Dry Creek, but the same type of behaviour is seen at Torrens Island and Mintaro:
With the half-hour price estimated to be $135.75 for the half-hour, this type of behaviour might be summed up as “loading in volume to score a reasonable price”.
19:20 – Wow! Price Spikes.
However the unexpected happens at 19:20, when the price spikes to $10,781.80/MWh (compared with the prior forecast of only $40.06/MWh). Again, we see some rebidding action:
This time, however, the rebidding works in the opposite direction. In the snapshot included, Infigen Energy rebids capacity at Lake Bonney 3 that had been below $0 up around the Market Price Cap. The same type of behaviour is seen for Lake Bonney 2.
[see further discussion below]
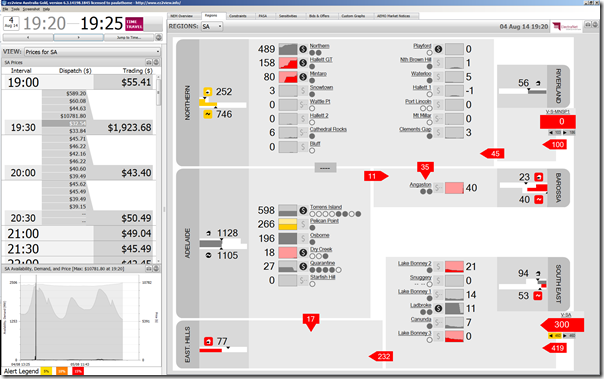
19:25 – action aplenty
As would be expected after the regional price hits a jackpot, there’s lots of rebidding along the lines of “gimme a piece of that action” for the half-hour:
Each “$” symbol on the display highlights how generators have shifted volume in their (fixed for the day) bid bands. I won’t dwell on any particular example – the pattern is the same.
As a result of this, note that the dispatch price now drops to $32.54/MWh – but, more importantly, the trading price for 19:30 is forecast to land at $1,923.68/MWh (not a bad dividend for a half-hour’s generation).
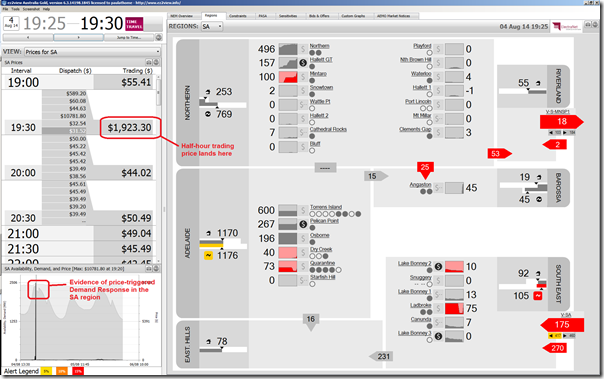
19:30 – end of the trading period
Wrapping up the half-hour, we see that the actual trading price for the 19:30 trading period lands at $1,923.30/MWh (just below the forecast from five minutes earlier):
This price is paid to all registered Market Generators * in the South Australian region for the generation they send-out in the half-hour (adjusted by the Marginal Loss Factor for each generator). How much they get to keep depends on their hedge cover.
* See the upcoming update in our 2014 Issue “Power Trading Schematic” for the latest list of registered Scheduled and Market generators, and the companies that trade their output in the NEM
This price is also the price paid by all wholesale Market Customers (generally just the Retailers, plus a few others) for energy consumed in the half-hour. This cost is also adjusted by the hedges these participants have in place.
Note in the snapshot above I have highlighted how the dip in scheduled market demand provides an illustration of active demand response in the South Australian region.
Determining how much demand response was activated is always an impossible task, for a number of reasons, including:
(a) The disaggregated nature of demand
(b) The propensity of energy users to keep these types of arrangements confidential (as competitive advantage); and
(c) The impossibility of determining “what would otherwise have been”
However a simple measure would be to take the difference between the demand at 19:20 (2,389MW – i.e. AEMO’s estimate of where the demand would be) and 19:30 (2,263MW) and conclude that it might have been 126MW of demand response – however this overlooks a number of factors, including:
(a) that the half-hour price was already forecast to be high, because of the $500 price at 19:05; and
(b) that demand might have been on a downward path following evening peakNote the previously posted full disclosure about our keen involvement in facilitation of demand response for energy users across the NEM – including some whose response would have featured in the dip shown above.
In the past, with examples like this (price spikes, especially unexpected ones – and especially when assisted by some rebidding behaviour) there has been some tut-tutting by a number of people about the rebidding behaviour of those “big bad coal generators” – with some additional finger-pointing reserved specifically for AGL and gas-fired Torrens in South Australia.
In years gone past, it became almost expected that the prices would spike around the time of evening winter peak in demand (for instance, here’s a record we wrote many years ago of what happened way back in winter 2002). We were amongst those who started using the term “economic withholding (or re-pricing) of capacity” to describe such behaviour. In more recent years, because of the significant oversupply of capacity that has resulted from the emerging trend of declining demand, coupled with ongoing development of new renewable plant backed by the MRET scheme, such opportunities are fewer and further between.
The analysis above is not meant to be exhaustive – and there are, no doubt, other factors that contributed to the spike. This article has merely been written to speculate when people will also begin to start tut-tutting about these “big bad green energy companies”?
In recent times, we’ve noted that various commentators have picked up on the inevitable outcome of the overhang of capacity – that it’s been hurting all existing generators, no matter what the colour:
(a) Reducing revenues at Infigen Energy (as noted by Giles and by John); and
(b) Being one of the factors delivering uncertainty that prompts Pacific Hydro to pull out of the Moree Solar Farm* (as noted by Annabel, by Tristan and by Giles).
* Hence prompting another update to our 2014 Issue “Power Supply Schematic” list of prospective generation projects
We’ve been wondering if the interests of generators might re-align from the current “green –vs– red –vs– black/brown” stand-off to one that is more “existing plant vs prospective new developments”. Perhaps this example points to more of what might be to come, as all existing generators with some market exposure (no matter whether black, brown, green or other) seek to utilise whatever capability they have to increase their return on investment.
This article has been written in an environment where (it seems to us) two opposing views of the future of the electricity market have been verbally jousting from ever-more-entrenched positions. As I have noted before, we strive to remain technology agnostic – focusing, rather, of the market impacts of generation, whatever the source.


Thanks Paul,
Interesting. How much money did Infigen make on their dispatched plant? I assume they didn’t curtail any capacity after the 5 minute spike?
Will have to have a look sometime, Ariel
‘This article has been written in an environment where (it seems to us) two opposing views of the future of the electricity market have been verbally jousting from ever-more-entrenched positions. As I have noted before, we strive to remain technology agnostic – focusing, rather, of the market impacts of generation, whatever the source ‘.
It’s rather quaint that you don’t take a stand on the use of coal for electricity generation. It flies in the face of science as we know it surely.At least 2/3 of it has to stay in the ground for goodness sake.
Thanks Neil
I appreciate that that’s your perspective – as it is for many others as well. Our focus is on how the market is operating, under whatever the rules are at present.
Paul