Two years ago, the Carbon Tax was introduced and we provided this review of what we’d seen happen in its first day of operations. Given the likelihood of the repeal process passing through the Upper House in the next few weeks, we’d thought (last week) about the possibility of doing a similar post this week (i.e. today).
This morning, coincidentally, we were greeted with an SMS alert in NEM-Watch Platinum – notifying us of a price spike in South Australia at 08:20. A double-incentive to have a look.
Using the “Playback” functionality in NEM-Watch, we’ve now re-wound the display to the first dispatch interval in that trading period and will walk through the day:
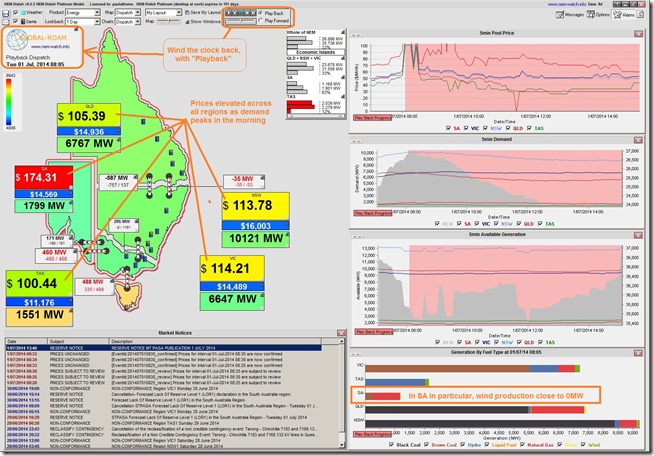
08:05 – Prices already elevated
In the first screenshot from NEM-Watch, we see that prices were already elevated in all regions as a result of several factors.
One of the factors, as shown in the chart in the bottom-right, is the lack of wind production today – almost the complete opposite of what the situation was last week, when the consistently windy weather contributed to new records being set.
If, as others had noted, wind was the new baseload last week, then this week we’ve just had a massive tube leak forcing more than 2,000MW of capacity (i.e. a distributed “station” the size of Loy Yang A) offline.
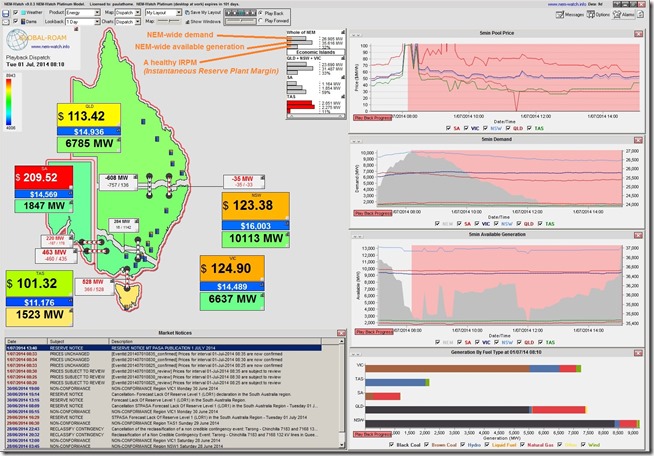
08:10 – prices creep higher
In the second dispatch interval we see the prices trend higher, as NEM-wide demand increases to 26,905MW (up just 19MW). However note that this small macro increase is the sum of increases in South Australia (up 48MW) and Queensland but decreases in NSW, VIC and TAS.
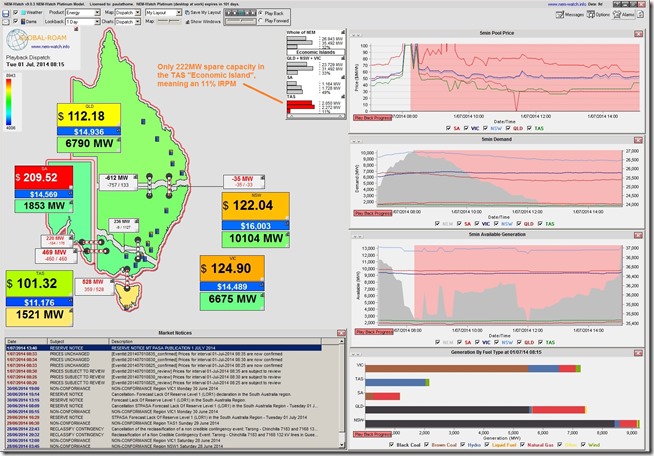
08:15 – prices steady
Five minutes later, the NEM-wide demand is up 38MW on the back of increases in VIC, SA (up 6MW) and QLD.
08:20 – Price Spikes
Another dispatch interval rolls on and we see the price spike in South Australia to $10,999.65/MWh – but fall in the other regions to more “normal” levels for a morning peak in demand (but levels that imply carbon pricing still taken into account):
08:25 – Price Subsides
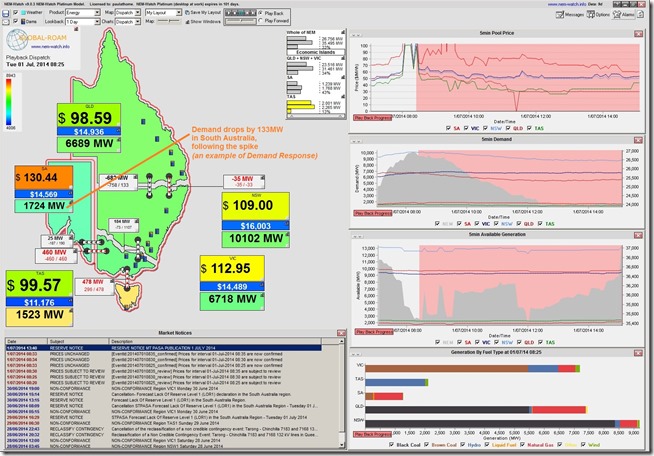
Five minutes later we see the effect that the price spike has had, in South Australia, on some price-sensitive demand. As noted in this NEM-Watch image, this shows some evidence of 133MW of Demand Response in the South Australian region, just on this instance (leaving aside the possibility that underlying demand might still have been growing).
We know that a number of our clients will, collectively, have amounted to a large share of this demand response – plus we know of other energy users in the region that also provide demand response in a number of ways.
* Note again how we have been active for more than a decade in facilitating some forms of this “Retail Demand Response” in the NEM.
The demand response shown here represents a fraction of the demand response we know to be active, NEM-wide.
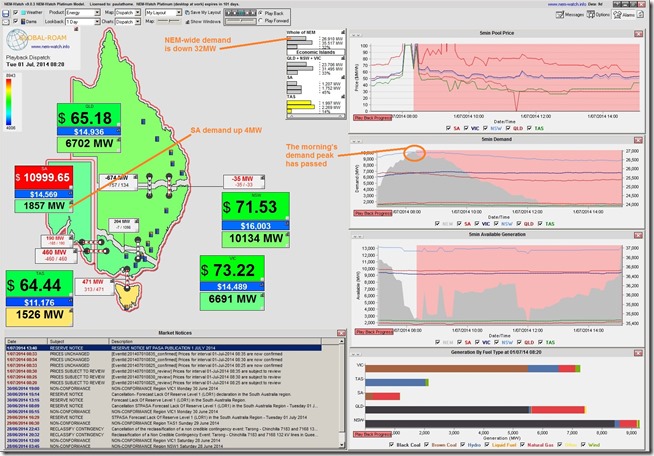
08:30 – prices subside further
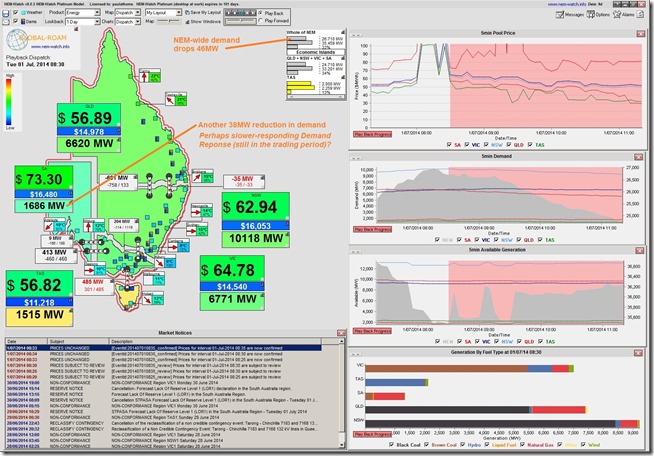
For the last dispatch interval in the trading period, we see prices subside further – and a further 38MW reduction in demand in South Australia (much of which seems to be slower-responding Demand Response that could not back out in the first dispatch interval).
08:35 – SA demand creeps back up as a new Trading Period starts
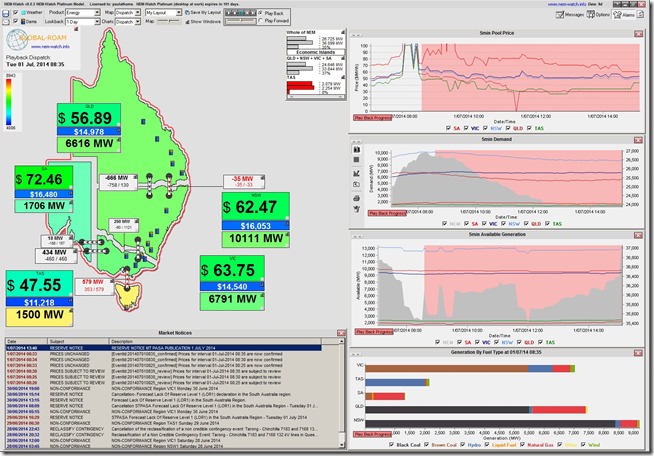
In the first dispatch interval of the next trading period, we see demand creep back up to 1,706MW:
Certainly in the above prices, there’s nothing indicating that generators have subtracted the price of carbon (which they are still paying, currently) out of their bids.


Leave a comment