In Wednesday’s post, we highlighted how two trends have been seen to emerge simultaneously:
1) Aggregate output from wind farms has climbed steadily to be approximately 3.5% of energy supplied in the 365 days to 25th July; and yet
2) There remain 6% of the trading periods in many months (approx 40 hours in a month) when aggregate wind farm output is below 145MW right across the NEM – this has been the case despite the commissioning of four wind farms in southern NSW in recent years. On the flip side peak daily output has been increasing and surpassed 50,000MWh for the first time on 4th July 2013.
There’s considerable intermittency in daily wind production patterns (or variability, if you prefer that term) – even taking into account the current degree to which wind farms are stretched from South Australia through to southern NSW including TAS. This result gives some hints that there may be issues arise as more wind farms are commissioned to meet the escalating requirements of the expanded MRET target.
1) How much wind energy could be accommodated, theoretically?
We wondered about projecting forwards in time – to see what these daily production patterns might imply by the end of the decade with respect to the possible contribution of wind towards the MRET target?
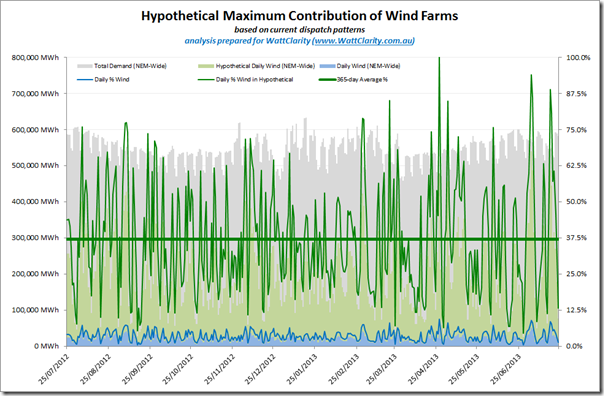
Given wind production has continued increasing steadily, we took a look at the 365 days leading up to 24th July 2013 and grew the daily wind output by 1060% – this revealed the following pattern of hypothetical output (in green) compared to the actual pattern (in blue):
In taking this approach, the simplifying assumption is that the installed capacity of wind would just be grown by this percentage, with the same relative distribution around the NEM as is currently the case, and with the same technology profile – hence the same output profile. As shown above, this assumption results in the hypothetical production from wind on 27th April 2013 equating to 100% of the operational demand in the NEM – with the percentage on other days scaled back from this.
Aggregated over the year, this hypothetical case represents a theoretical maximum contribution of wind on an annual basis being 37% of energy consumed in the NEM – subject to the assumptions below.
2) What would be the “spare” capacity required
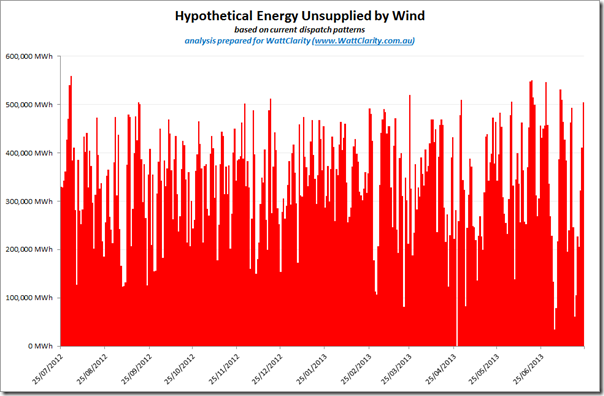
Also of interest to us in this hypothetical daily production trend is the fact that there are a significant number of days when daily contribution would still have been below 10%. In other words, the “daily energy unsupplied by wind” (in the scenario above) would have looked as follows:
A daily energy supply requirement of 500,000MWh equates to an average daily demand of just below 21,000MW – meaning that, in the scenario above, the NEM would still need to have at least* 21,000MW of non-wind installed capacity available to supply energy demand for those days when the wind was absent.
* we say that the installed non-wind capacity would need to be at least this much in order to provide for the variability of wind and demand within each day – and to cater for (planned and forced) outages of this non-wind capacity.
3) Key assumptions in the above
Obviously there have been a number of simplifying assumptions made in the above – including the following:
Assumption #1) That demand across the NEM in 2020 is the same as it was for 2012-13.
We’ve discussed previously how demand in the NEM has been declining for a number of reasons – the outcome of which meaning that it’s a lot less certain, now, where demand will be at the end of the decade.
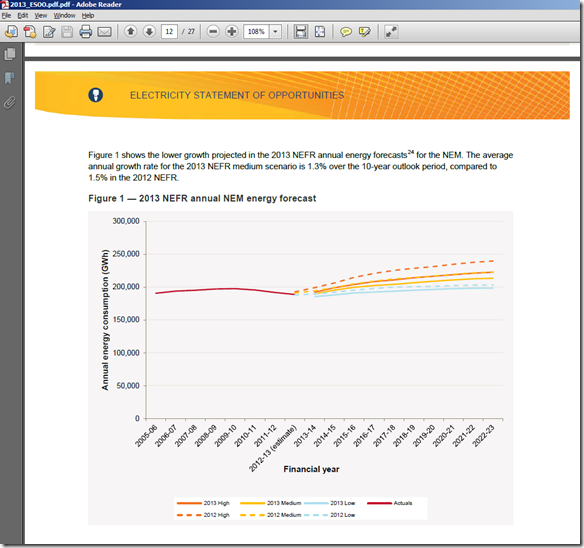
In the recently 2013 issue of AEMO’s “Electricity Statement of Opportunities”, the three different energy growth scenarios show a less bullish forecast than was the case even just a year ago:
Even if the volume of energy does grow to 2020, assuming that the pattern of daily demand does not significantly change, the above analysis would still be true (in terms of percentage supplied).
Assumption #2) That wind harvesting patterns do not fundamentally change:
In the analysis above we have just grown daily production from wind by the same ratio across all days – i.e. in effect assuming that each existing wind farm was grown in installed capacity by the same percentage, on the same site.
In reality it is likely that the wind harvesting patterns would change somewhat* due to:
(a) More geographically diverse sites being developed – especially if these were to be in northern NSW or Queensland (where, presumably, the wind distribution patterns show more difference from the aggregate ones above).
(b) Other technologies being deployed (such as turbines that can harvest lower or higher wind speeds, etc…)* This is not our area of expertise and so would appreciate comments from readers below who have some facts that might inform us?
Assumption #3) That there is no large-scale energy storage technology deployed in the NEM.
Currently energy storage technology cannot be commercially deployed across the NEM, at scale.
There are organisations working on a variety of technologies that might, one day, provide for storage at scale – we would also welcome comments below from people who know more about storage technologies than us.
Should energy storage technologies be deployed in the NEM, then this would fundamentally change the above. The analysis above highlights some of the technical challenges that would be imposed on such technology (e.g. the extremely peaky nature of the demand for storage, taking into account the large variability in wind farm output).
4) With respect to the current MRET target
Currently the MRET target is not for renewable supplies anywhere near 37% of the energy consumed in the NEM.
Even with the current level of the target, however, the above analysis illustrates the degree to which there will need to be other, complementary technologies installed and available to meet demand when the wind is absent.
Some of these might be other renewable sources (solar PV being the current growth area) – however in 2020, at least, the significant contributor will still remain gas-fired or coal-fired thermal generation.


Interesting analysis. An interesting next step would be to estimate what would be the average cost of electricity for the 365 days.
Since the purpose of the RET, and for installing wind power, is to reduce CO2 emissions from electricity generation, the next step would be to calculate how much CO2 is actually being avoided. To do this, we need to know the effectiveness of wind power at cutting CO2 emissions. Many studies using empirical evidence show it is much less that is normally claimed based on modelling studies. The study by Joe Wheatley [1] suggest wind was only 53% effective at cutting CO2 emissions from the fossil fuel generators in Ireland in 2011; i.e. 1 MWh of wind generation reduces the emissions from the 1 MWh of displaced generation by just 53%.
Having calculated the average cost of electricity and the CO2 emissions from the NEM with and without wind generation it will be an easy step to calculate the CO2 abatement cost (in $ per tonne CO2 emissions abated). Expect the CO2 abatement cost to be around a hundred of dollars per tonne CO2 avoided.
[1] Joeseph Wheatley (submitted 2012) “Quantifying CO2 savings from wind power: Ireland”
http://docs.wind-watch.org/Wheatley-Ireland-CO2.pdf
Thanks Peter
You raise 3 points:
1) Regarding the cost of electricity under the hypothetical case, each analyst will have their own point of view – with a wide diversity almost guaranteed. Suffice to say that this would be impossible to forecast what the actual price would be under such a scenario, as to do so would require predicting human behaviour in terms of trading decisions. It seems likely that the wind farm generators, were they to provide a more significant stake of energy in the NEM, would not continue to follow their “price taking” behaviour at present.
2) Regarding the MRET, my understanding of the original genesis of the scheme was that it was partly to do with carbon reduction, but also partly to do with support for a nascent renewable energy industry in Australia (for reasons broader than just carbon).
3) Regarding avoided carbon emissions, frequent readers here (and elsewhere) will see a tiring pattern in the fact that you frequently add this in, citing a single reference from a different market that aligns with your own particular perspectives. It’s not something we will be focusing on through WattClarity (the focus of which is energy supply, whatever the source).
Paul
Hi Paul
Not sure if you have analysed the AEMO 100% RE study. The 2030 scenario 2 has a demand of 290 TWh/yr = 800,000 MWh per day. Of this wind provides 111 TWh/yr or 38% – around your maximum. Maximum demand in the network is 46,000 MW.
Total capacity installed in 2030 (all RE) is 98,000 MW of which wind is 30,000 MW (a generous capacity factor of 42% – must include off-shore wind as well). They admit that they would need >200% more capacity than maximum demand.
Regards Martin
Thanks for pointing that out, Martin,
The 21GW figure above for idle capacity would probably be larger than that if we looked on a 5-minute by 5-minute basis, rather than the day-by-day basis of the above – hence maybe it would be somewhere near the “equal to peak demand” figure you note.
Paul
Great analysis Paul. Much more realistic than the usual overly optimistic/pessimistic reports I read.
With regards to your assumptions: I think it likely that geographic site diversity will be become more important than capacity factor over time. If your wind farm has the same output profile as everyone else you can expect to get lower spot prices and vice versa. Wind turbines designed for low wind conditions will be enable the move away from the southern coast. We haven’t even touched the wind resources that aren’t world class. Anyway it is likely that there will be a smoother profile than what you have extrapolated but it would not remove the need for back up supply.
I did some research on lithium batteries a couple of years back, and since then it seems that project costs have dropped by 50%. If the battery technologies keep moving at that rate it won’t be too long before they stop being horribly expensive and start playing some role in the energy market.
The Germans and Danes have put some effort into turning an oversupply of wind power into hydrogen. This may also become viable in the future with an international gas price on the east coast and occasional electricity gluts.
Thanks,
Tom
Thanks Tom
Can you point to some numbers on the cost of energy storage technologies to expand on what you’ve written?
Paul
Hi Paul,
Elec to hydrogen costs $2/W. Pretty expensive for a reverse peaker 🙂
http://fuelfix.com/blog/2013/06/14/hydrogen-plant-starts-storing-wind-energy-in-germany/
Lithium was ~$6/W and is now ~$3/W if I recall correctly. I didn’t find any decent links.
According to the ESAA’s latest Annual report, there is well over 45GW of non-wind generation capacity installed in the NEM. In addition, there are periods overnight on almost any evening, when over 21GW of electricity generation is “on stand-by”. Therefore, it is not clear what the significance is of your conclusion that 21GW of non-wind generation capacity will be requrired “on standby” should wind energy achieve a 37% market share (more than twice the current LRET target).
If you are making the point that no additional “back-up” generation is required to achieve much higher levels of wind generation then I would certainly agree with that. AEMO’s latest SOO states that no new thermal generation (“back-up” or otherwise) will be required in conjunction with the current LRET target, so AEMO would apparently agree with such a conclusion as well.
Thanks Jonathan
My main motive in have a look at this case was just in seeing how much wind would theoretically fit in the NEM under the assumptions listed (i.e. not related to current MRET target level).
In terms of the energy (and hence capacity) gap that would arise between windy and non-windy days, it would follow that this would also be a hypothetical case.
It’s probable that the challenges to be addressed are both:
1) Technical, in terms of balancing supply and demand over various time-frames (above is just day-by-day transitions)
2) Commercial, in terms of some form of changed compensation structure to provide the residual plant some incentive to remain operational for lower energy volumes (hence revenues in an energy only market), whilst still remaining available for much the same level of capacity reserve requirements. One option might be just to continue with the current structure, but understand that there’d probably be a lot more volatility present.
Paul
There is currently plenty of peaking capacity that rarely gets used. In the AEMO 5-minute production data for stations on the network, many of the Queensland gas power stations rarely get used. I have never seen power output listed from Snuggery (near Mt Gambier), nor Bell Bay gas. The hydro stations seem to be well below their potential for balancing the peakiness of wind. Tumut 3, for example, has 1500 MW of generation capacity and about 200 MW of pumped storage. If we were approaching the limits of wind into the network, it would be operating at close to capacity at times of low wind and high demand, while under the converse conditions its pumped storage would be operating at full capacity, and the 200 MW of pump from Lake Jyndabye to Eucumbene, After looking at many days of the AEMO data, I have never seen this occur. With wind currently supplying such a small proportion of the Vic-NSW demand, there is as yet little need for pumped storage to balance out the vagaries of wind.
The gas backup capacity will become much more expensive once the LNG plants at Gladstone start competing on the Eastern Australian gas market. Additional wind capacity will mean we won’t need to use as much gas in power stations. The price relativity between wind and gas will be less, but we still have the capacity built at a time when gas was cheaper.
My personal preference is that as wind is now a relatively mature technology, our public sector by incentives should be moving to geothermal, which is scheduled capacity. For example can we decrease the cost of power produced by this technology by the horizontal drilling now used by the fracking industry ? Instead the erratic wind power is making the price of renewable energy certificates too cheap, and hindering the development of geothermal.
Hi Paul,
I’m not sure I fully understand your analysis. Am I correct in saying that you’ve scaled up wind production until it achieves 100% of daily energy on a single day, and using that as the maximum capacity/energy that can be installed?
If so, I don’t think that’s a particularly meaningful number – it’s quite feasible you’d install more wind, and spill some energy on that day. After all, we currently install much more capacity than the peak demand day.
Ultimately, the penetration of wind comes down to two factors: economic and technical. There’s no technical reason why you couldn’t install much more wind than that, and curtail it on the highest wind/demand ratio days. Indeed, some of ROAM Consulting’s integrated resource planning modelling (slide 15, although the full detail isn’t on this slide) shows that a high penetration of partially curtailed wind can be least cost, particularly under moderate carbon prices and high gas prices. (E.g., if the LCOE of gas was $120/MWh and of wind was $100/MWh, then wind could be curtailed by 15% and still be least cost.) Longer term, this seems the sort of world we’re approaching. If costs are higher however, then your argument is probably more accurate, but you still need to consider economics.
On the technical side, this could potentially act as a limiting factor on penetration of renewables; AEMO suggested that the power system is operable with at least 15% of energy in each period coming from synchronous generation. More sophisticated studies are needed to understand exactly how much inertia, spinning reserve, etc., is required online.
This is something we’re thinking lots about, and would be very happy to discuss further.