As noted a couple of weeks ago, we saw that output from hydro generators increased slightly in the first week of the carbon tax, compared with the prior week.
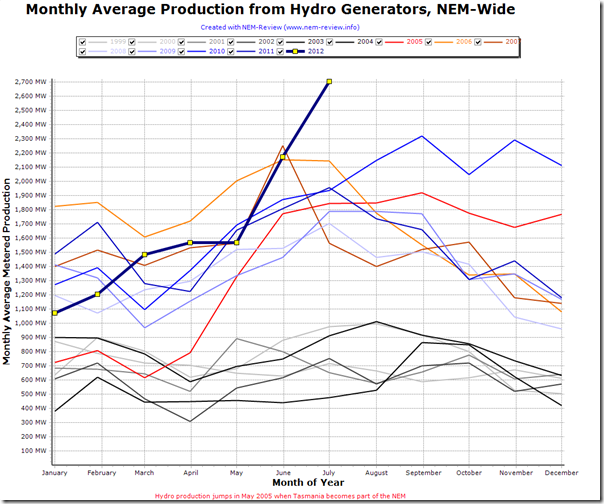
Two further charts from NEM-Review are included here to highlight how the carbon tax (and other factors, such as Yallourn being unavailable due to coal supply issues) has resulted in production levels at hydro plant higher than that delivered in any prior month over the history of the NEM:
(interestingly in this chart, we also see that hydro production levels through 2006 and 2007 – particularly drought affected years – were not substantially lower than the years following, when hydro levels increased)
In the chart above, we see a distinct increase in production levels throughout 2012 from a low point in January, with a pronounced kick beginning in June (as the output of Murray increases in response to the problems at Yallourn) and continuing in July (in response to the changing cost structures of other plant under the carbon tax).
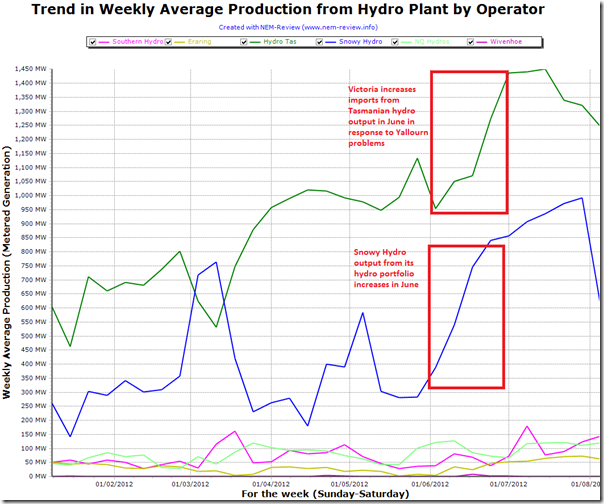
This is highlighted specifically below, where average output is shown on a weekly basis by hydro system:
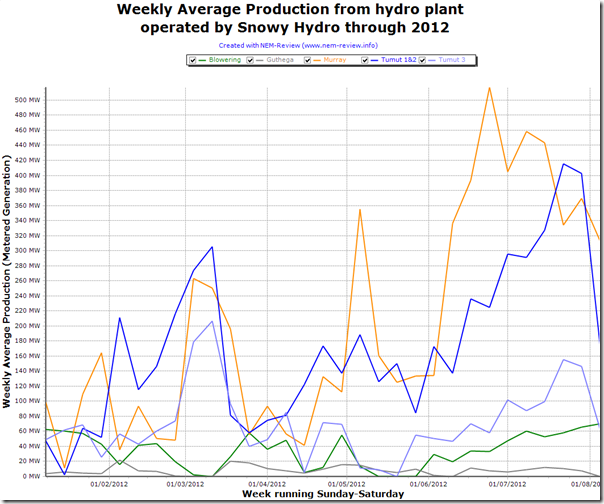
In the final chart, we see how output from Murray (in the VIC region) increased through June but then has tailed off through July as Snowy Hydro has, instead, increased its output of the Tumut units in the NSW region.


Leave a comment