Once again a very interesting day in the market.
Would have spent more time watching the screen if it was not for other initiatives on the go at present (will tell you about them at “Behind the Scenes” at some other time) and so the following are just a few snapshots of the market taken automatically by a couple of copies of NEM-Watch we have running in various locations:
Thursday 19th November at 14:50
As I noted yesterday, the AEMO was warning of the possibility of a tight supply/demand balance in NSW today from yesterday afternoon – through their “Market Notices”, which can be seen through NEM-Watch.
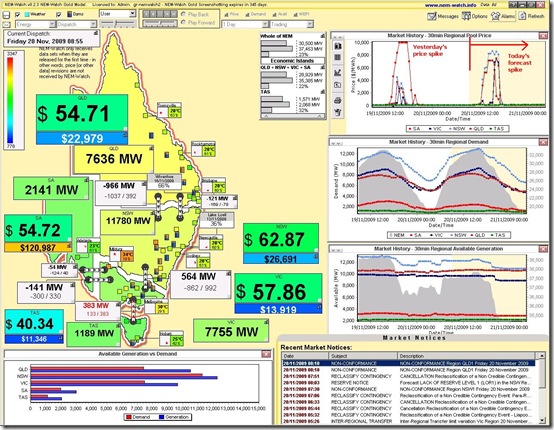
Friday 20th November at 08:55
See the snapshot taken below at 08:55 NEM time (09:55 daylight savings).
The NEM-Wide demand had already climbed past 30,500MW early in the day, with QLD and NSW regions showing a distinct yellowish colour (denoting demand levels higher than average).
See in this image that the Cumulative Price in SA had climbed back up past $120,000/MWh as a result of the sustained price spike that had occurred yesterday in SA.
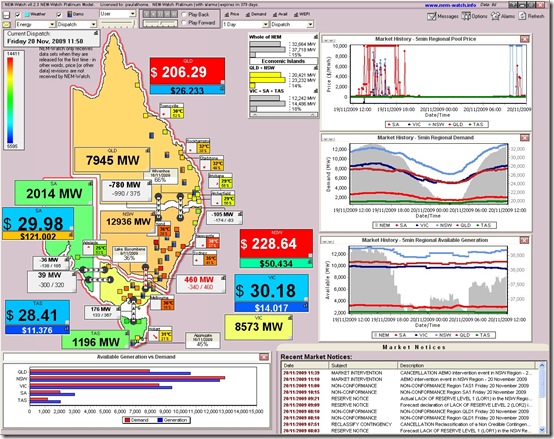
Friday 20th November at 11:50
At 11:50, we can see in the snapshot included below that the demand levels had climbed in NSW and QLD, in particular – but also in VIC to a lesser degree.
In contrast, SA is shown to be experiencing a pleasant change from the heatwave of recent times.
In this snapshot, you can see that the IRPM in the QLD+NSW “Economic Island” had already dropped below the warning level of 15% – and prices had started to rise.
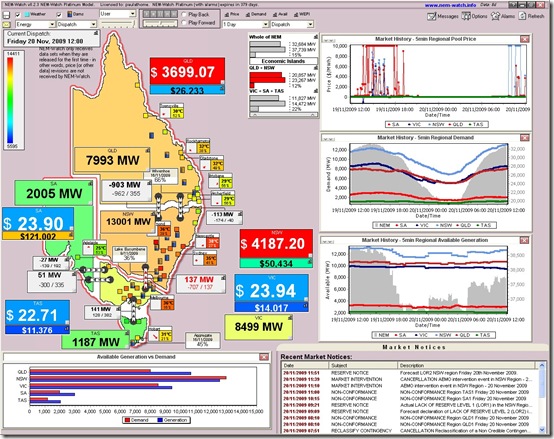
Friday 20th November at 12:00
At 12:00 we see the price spike above $1000/MWh in NSW and QLD for the first time today.
We also see that, at this point in time, the NSW+QLD “Economic Island” had dropped to only 2410MW of spare capacity – meaning an IRPM of 12% in that combined area of the NEM.
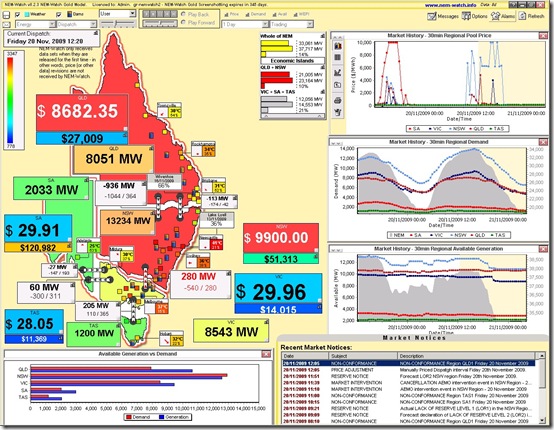
Friday 20th November at 12:20
At 12:20 the NEM-wide demand peaked for the first time today – and at its highest level over the day (33,061MW).
Note in this instance that the NSW and QLD regions are shown as red in this snapshot as the snapshot has captured them in the red “flash” stage of the alert we have set up to denote high prices.
Unfortunately, no automated snapshot taken to included here!
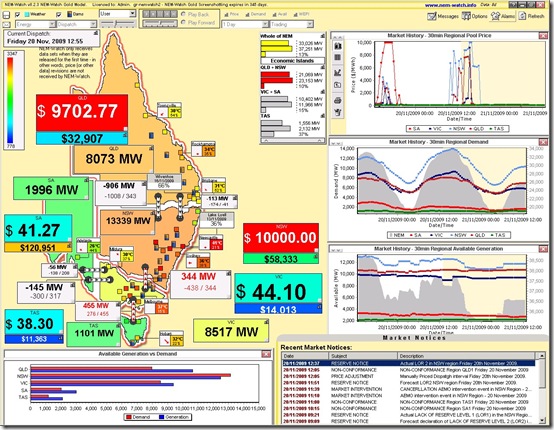
Friday 20th November at 12:55
At 12:55 we see that the NEM-Wide IRM dropping to a low of 12.72%
Friday 20th November at 13:00
At 13:00 the NEM-wide IRPM had dropped to its lowest level today (12.66%) as the NEM-wide demand had climbed higher for the 3rd time today (to 33,051MW).
Unfortunately, no automated snapshot taken to included here!


Be the first to comment on "NEM-Wide demand soars, and IRPM drops, on a hot spring day"