There’s two answers to that question (well, at least two) – it depends on whether you were thinking about winter in the traditional sense, or “winter” in relation to our Best Demand Forecaster for Winter 2009 Competition!
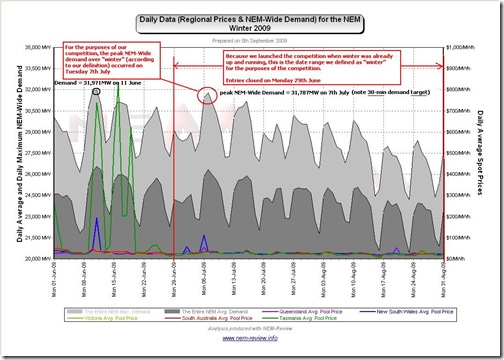
The following chart (from NEM-Review) provides an explanation of the difference, and the two answers:
As noted in the diagram, we defined “winter” as the period from the day entries closed (29th June) through until the end of August. Hence, you can see how:
1) The highest NEM-Wide demand was actually recorded on Thursday 11th June 2009 (which was before entries closed)
– what happened on the 11th June is further discussed here.2) In the period we defined as “winter” (for the competition) we can see that the highest NEM-Wide demand occurred on Tuesday 7th July 2009.
.
What was it, on a dispatch (5-minute) basis?
Also noted in the diagram, NEM-Review provides updates of only the 30-minute “trading” data, as published by NEMMCO/AEMO. Whereas in our competition, we asked for the highest NEM-Wide dispatch target demand (which is what is shown in NEM-Watch in real-time).
With reference to our infoserver replica, we found that the peak NEM-Wide Demand Target (on a NEM-Wide basis) for “winter” occurred at 18:25 on the 7th July 2009, and was at the level of 31,873 MW.
Note that this number is higher than that shown in the chart above, as the data from NEM-Review is the trading (i.e. 30-minute) data, which is the simple average of 6 x 5-minute dispatch demand figures that occurred in that half-hour.
.
So who won the competition?
Now that we have established what the peak demand was for “winter” 2009, we can now investigate who won the competition….


Leave a comment