.
Background
I have been pondering this question for a while
Back in January 2009, we saw previous summer peak demand records smashed on a NEM-Wide basis, and for VIC and SA, as a result of the heatwave. These events caused dramas in their own right, and were a precursor to the deadly bushfires that followed shortly afterwards.
In July (when I finally had the time) I tried to answer the question “Should last summer’s peak NEM-wide demand have surprised so much?”. In summary, I found that the peak demand experienced in January was not out of the realms of probabilities – but just seemed like such a massive jump in demand because the previous couple of summers had been relatively mild (in terms of coincident demand, at least).
However, one other question** that the above answer triggered was to see whether NEMMCO’s PASA forecasts were useful in giving the market/industry a “head’s up” to the level of peak demand to be expected.
** Actually, there are many, but this is the one I had time to have a look at over the weekend
Following on from a very hot November, when there has been plenty to report on in terms of the NEM, I generated the following analysis.
What are PASA and NEMforecast?
Both are good questions. I will have a go at answering both below.
PASA = Projected Assessment of System Adequacy
The AEMO (formerly NEMMCO) utilises a number of planning horizons, in terms of forecasting the supply/demand balance across integrated regions of the NEM.
Each serves their own purposes and is outlined here:
1) 10-year look ahead
On an annual basis, AEMO publishes an “Electricity Statement of Opportunities” (ESOO), which is a 10-year look ahead of the supply/demand balance.
As the name suggests, the focus of this document is to signal development opportunities – to potential project developers (and others) where there are emerging opportunities to develop new generation plant, or perhaps new transmission interconnection. Because this is the focus, the time-horizon needs to be sufficiently out into the future to enable sufficient time for the market to respond. NEMMCO/AEMO has chosen a 10-year horizon.
Because of this, it is almost assured that (in an efficient market) at various stages in the forecast horizon, AEMO will be flagging that new generation capacity will be required. Were this not the case (in a market where demand is consistently growing), it would be a sign that the market had over-invested in capacity before it was required.
Because this document is published only once each year, these forecasts are provided in the form of a large document that is posted on the AEMO website, and available at public forums upon its launch each year.
To provide some context to “current” demand levels at any given point in time, we have included in NEM-Watch v8 the ability for you to compare the current demand level to AEMO’s latest forecasts for the peak demand to be experienced in the current summer/winter periods.
See the post I made previously following the launch of the ESOO earlier this year.
2) 2-year look ahead
On a weekly basis, AEMO updates an Medium Term “Projected Assessment of System Adequacy” (MT PASA) which extends from the following Sunday out 2 years into the future.
Data is provided on a daily granularity, with a single time point per day, being the assumed peak demand that day under extreme weather conditions (i.e. 10% Probability of Excedence). Because the frequency of data publication is more frequent than with the ESOO, the AEMO publishes these data forecasts as raw CSV files on their website, and through their dedicated NEMNet trading environment.
Because the look-ahead spans only 2 years, it incorporates the entry of only generation plant (and major new loads) whose development is already well underway. The primary purpose of MT PASA is a feedback mechanism to generators to allow them to plan their outage schedules in such a way that the supply/demand balance in the NEM is not threatened.
AEMO has provided this webpage to explain MT PASA (and ST PASA) in further detail – click through the links at the bottom for more information.
2) Weekly look ahead
On a two-hourly basis, AEMO updates an Short Term “Projected Assessment of System Adequacy” (ST PASA) which extends from the following trading day out 7 days into the future.
Forecasts are updated every 2 hours and are for each trading interval over the 7-day period. In a key difference to MT PASA, demand forecasts are produced for three different weather scenarios – mild (90% POE), average (50% POE), and extreme (10% POE). The primary purpose of ST PASA is to allow generators to make final adjustments to outage plans such that the supply/demand balance is provided for under all scenarios.
Because of the regularity of data updates, AEMO publishes these forecasts on their website, and through their secure NEMNet trading environment.
AEMO has provided this webpage to explain ST PASA in further detail.
4) Daily look ahead
Every half-hour, AEMO publishes a predispatch forecast (including price forecasts) for every trading interval out till 4am tomorrow, or the day after. This forecast is used by both supply-side and demand-side as a trading feedback loop.
The predispatch data is updated through a number of our other software packages (including NEM-Watch).
NEMforecast = our PASA-viewing software
Our NEM-Watch software was first released in 2000.
Since those early days we periodically received calls from clients, asking that we also produce a similar tool for making sense of the PASA forecasts.
To address these requests, we put our NEMforecast software together and released this in 2005. This software provides our means for viewing and analysis of the various PASA forecasts.
.
What were the PASA forecasts predicting
At this stage (22nd November), I have only looked into the PASA forecasts generated for the Victorian region. When I have more time, I will also look into the other regions and will expand on this post below.
PASA forecasts for the Victorian Region
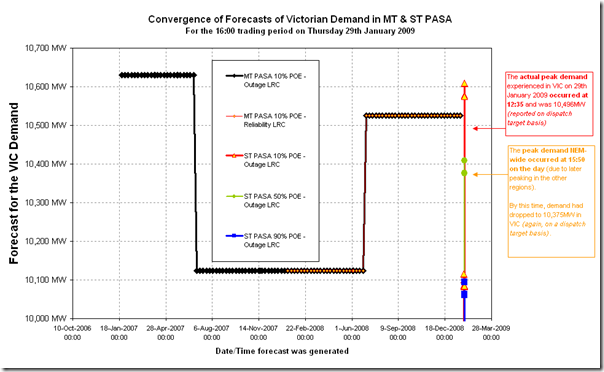
The first chart (below) highlights how NEMMCO’s MT PASA forecast for the peak daily VIC demand on 29th January converged on the actual demand experienced that afternoon.
As can be seen, there was a high degree of correlation between the 10% POE peak daily demand forecast and the demand level experienced on the day (particularly at the time of the afternoon when the VIC demand peaked.
Shown on the chart are two different demand forecasts (“outage LRC” and “reliability LRC”) to demonstrate that the forecasts are identical under these two NEMMCO scenarios, which are used for other purposes.
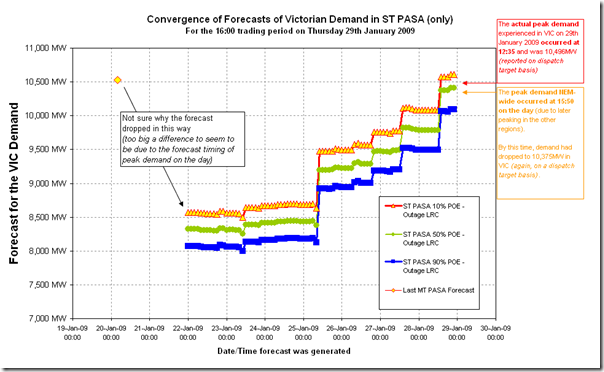
The second chart (below) “zooms in” to the week preceding 29th January, in order that we can see the ST PASA forecasts in more detail.
As can be seen above, the last MT PASA forecast produced turned out to be a good estimation of what would happen on the day. However, when the ST PASA forecasts started being provided, they were clearly based on the assumption of a much milder day.
We have not investigated in any further detail to ascertain why this was the case.
From a low starting point, we can see that the ST PASA forecasts were progressively increased across the preceding week to deliver forecasts that were, in the end, much more representative of what demand levels on the day actually turned out to be.
PASA forecasts for the South Australian Region
Analysis now included online in “part 2”
PASA forecasts for the Tasmanian Region
Analysis now included online in “part 2”
PASA forecasts for the NSW Region
Analysis now included online in “part 2”
PASA forecasts for the QLD Region


In your description of the 10 year look ahead (ESOO) you have
“Because this document is published only every 10 years, these forecasts are provided in the form..”
You have missed a bit – it is published every year, looking ahead for 10 years … – or something similar.
Might be worth changing to avoid confusion.
Cheers
Tim
P.S Really enjoy your updates.
Thanks for picking that up, Tim!
Silly mistake – have corrected now.
Cheers
Paul
Paul
There are several problems with load forecasting and predispatch for the 1 in 10 year event or even more extreme event.
a) AEMO do not appear to adjust the predispatch forecasts for humidity and wind speed. In contrast the Victorian gas industry does. (So AEMO has access to the skills set from VENCorp to make the approariate adjustment to the process.).
Over the years the Reliability Panel in their Annual Market Performance Review present information relating to variations in predispatch forecast and the actual dispatch in Figures 5 to 10 in their draft Report 2009. They appear to have convieniently exclude errors associated with peak loads. Several of the earlier AP Performance reports indicated significant predispatch errors. Each year they claim to be reducing the number and size of errors.
b) There is limited information relating to size and type of airconditioning for less than 160 MWh consumers across the NEM. My local Harvey Norman sold $ 180,000 worth of air-conditioners on the 6th of Feb 2009, the next summer they will add to peak demand along with the new consumer added to the system. Energy Australia is one of the few distribution businesses who penalise consumers for moving from one to three phase.
One can also interpret the data provided by ETSA from their Demand Mangement trial that 75% of the air-conditioners in SA need to be replaced so that they can effectly load control the business!
Thanks for the comments, John,
The analysis above (and what I have added today for the other 4 regions, and linked above as well) just relates to the MT PASA and ST PASA forecasts.
As I noted in my “part2” post, there are a number of things about these forecasts that I don’t fully understand.
The issues you raise with respect to pre-dispatch are additional to these (and relate to an even shorter time-horizon forecast), and I have not spent any time thinking through these.
Certainly I agree with you that one of the largest uncertainties facing everyone in the NEM is the fact that there is no central reference that indicates how much new demand capacity (particularly AC loads) has been added in each distribution substation area from one year to the next. As far as I am aware, no-one really knows the full picture!
Cheers
Paul