
It would be difficult for any single product name to fully convey the breadth and depth of the analysis that’s been contained therein – amounting to 530 pages across 5 discrete parts.
Because of its size, clients who purchase the Report Card receive:
1) Access to a searchable electronic (PDF) file – for use across your whole organisation; plus
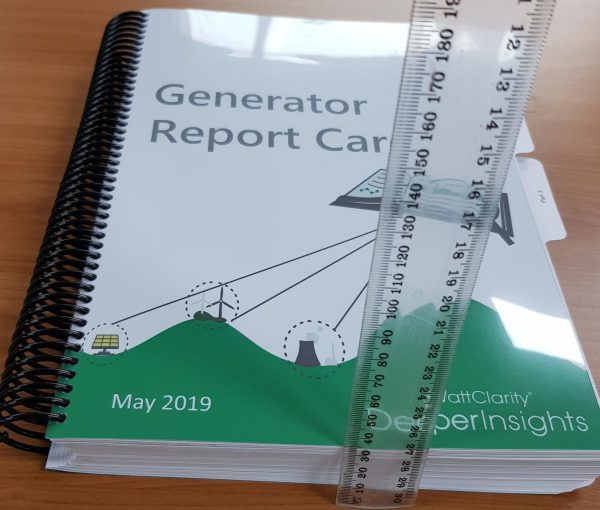
2) One hard copy is also supplied for your use. At 530 pages, the hard-copy is over 3cm thick (double-sided):
Across the 5 parts of the report, we deliver two principal components of value:
| ~170 pages of Detailed Analysis | 328 pages in a unit-level “Generator Statistical Digest“ |
|
| Part 1 – Executive Summary | In a brief (8 page) Part 1 we include an Introduction to the Report Card (including a “how to read”) and a brief Executive Summary. | |
| Part 2 – Key Insights | With reference to analysis of 20 years of history of the NEM we assembled 14 Key Themes and presented them in separately digestible pieces of insight.
This part was 67 pages. |
Readers might like to reference the unit-level data summarised in Part 3 to ascertain for themselves about the key insights. |
| Part 3 – Detailed Unit Data | We chose to break the analysis between Part 2 and Part 4 (with the statistical Part 3 in between) because the data conveyed in Part 3 was central to the insights generated in Part 2 and Part 4, and should not be relegated to the supplementary role of an “appendix”.
Too often we have seen this happen, to the detriment of those readers (who don’t invest their own time to ascertain what the numbers are actually telling them). |
In this section of the report, we presentedone page per DUID (AEMO’s dispatchable unit identifier) covering: 1) all generation units that had showed output data within the 10-year period ending 31st December 2018; and 2) also including Scheduled Loads (charging side of batteries, and pumping side of pumped hydro).Being one page per unit, this was 328 pages long. Here’s a description of the 1-page structure in the draft of 26th April 2019. |
| Part 4 – Results Aggregated | The detailed analysis that had been completed was continued into the 101-page Part 4.
In this section, we aggregated results in a number of ways in order to draw out other insights:
|
Readers might like to reference the unit-level data summarised in Part 3 to ascertain for themselves about these additional insights. |
| Part 5 – Glossary | We’ve compiled an extensive (19 page) glossary of the different metrics used in the development of the Generator Report Card. | |
If you’re ready to receive your own benefits from having access to the Generator Report Card across your organisation, then send us back the order form linked here straight away: