
It’s been a bit of deja vu in NSW today, with conditions somewhat replicating yesterday’s ‘out of the blue’ volatility event — although with many new features and, in several respects, a more extreme set of outcomes.
Once again we saw a mix of weather-driven demand shifts, interconnector behaviour, binding constraints and other factors all converging in a very tight window of time.
In this article, I’ll touch on the high-level dynamics at play, with deeper dives to follow if time permits. No promises, though — my attempt this morning to analyse yesterday’s events was quickly derailed by what unfolded in the market today.
Prices
At the 11:00 dispatch interval (12:00pm in Sydney), the NSW spot price spiked up to the Market Price Cap (MPC), holding there for three more intervals before dropping. Around an hour later, from the 12:05 dispatch interval, it sank to almost the Market Price Floor (-$1,000/MWh).
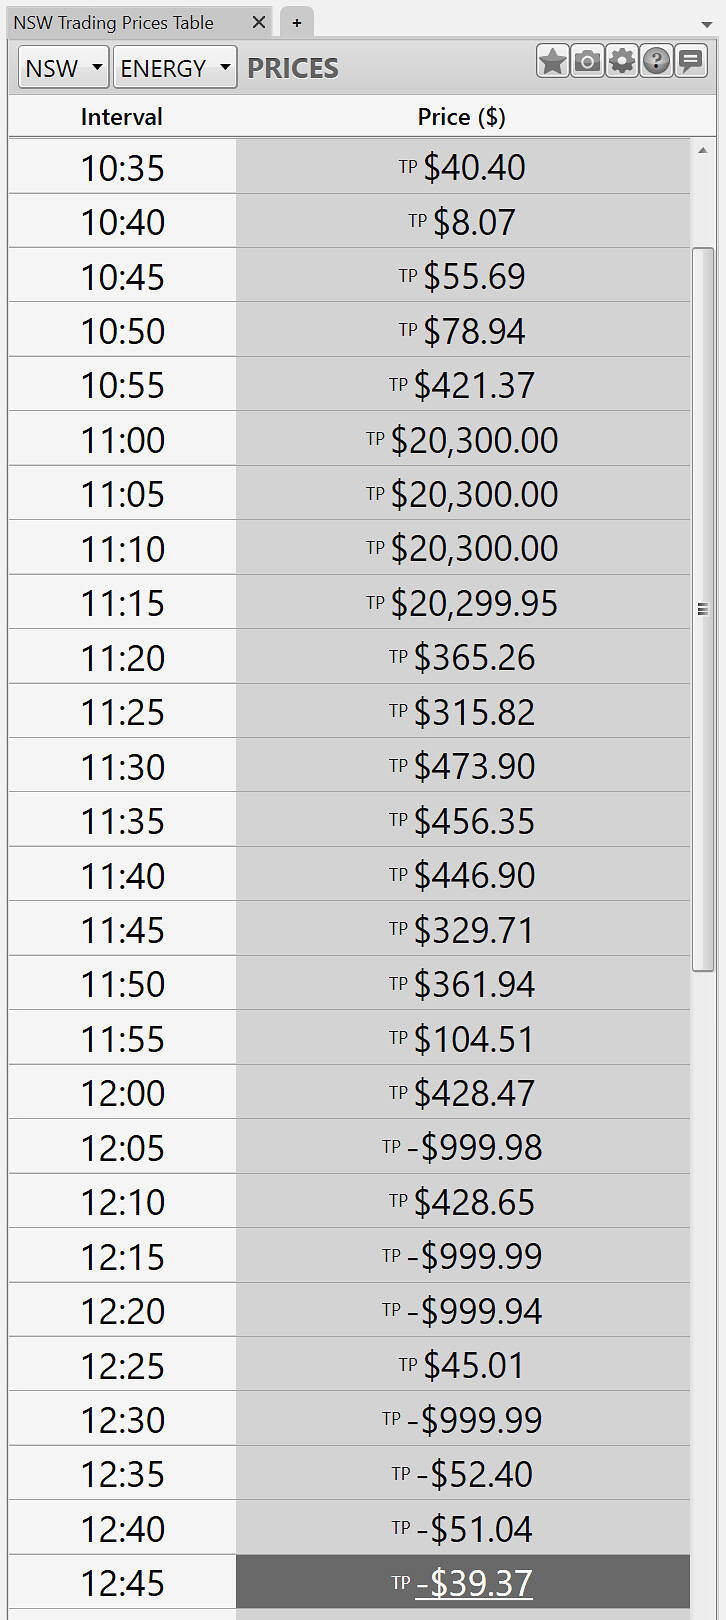
The spot price in NSW swung from the market price cap to virtually the market floor within a one hour period.
Source: ez2view’s Trading Prices Widget. Screenshot taken at 12:45 NEM time.
Yesterday we saw a (record) $21,019.65/MWh intra-day price spread in NSW. That record didn’t last long, with the low point landing just $0.01 above the Market Price Floor, meaning today’s spread reached $21,299.99
Ben Skinner left a comment on our article yesterday, making the point that this particular record will likely be broken each financial year as the MPC is indexed to inflation. This is true, however the spreads we’ve seen over the last couple of days remain notable because:
-
Since the introduction of 5-minute settlement, it is relatively rare to see both the Market Price Cap and the Market Price Floor hit in the same day.
-
The MPC for FY25/26 increased above CPI for the first time in 13 years, widening the gap to the floor beyond inflation-based adjustments.
It’s also worth highlighting that today’s price dynamics were more extreme than yesterday’s in a couple of meaningful ways:
-
The price hit the MPC and then the floor within just one hour, producing a much tighter whipsaw.
-
Volatility was more sustained: rather than brief spikes, NSW sat at or near the cap for four intervals, and near the floor for four more — meaning some (well-located) generation and storage facilities might have had more of an opportunity to respond.
Demand
High temperatures across the state’s metropolitan areas before midday pushed demand higher than usual.
AEMO had a challenging time forecasting market demand today, with both the heat and fast-moving cloud cover complicating conditions. The rapid movement of clouds can cut rooftop PV output with little notice — and because this generation is largely invisible to the market operator, it adds another layer of uncertainty to their forecasting models. Readers might be interested in this academic study that we recently shared on how sudden drops in rooftop PV generation can affect AEMO’s operational forecasting on extreme days.
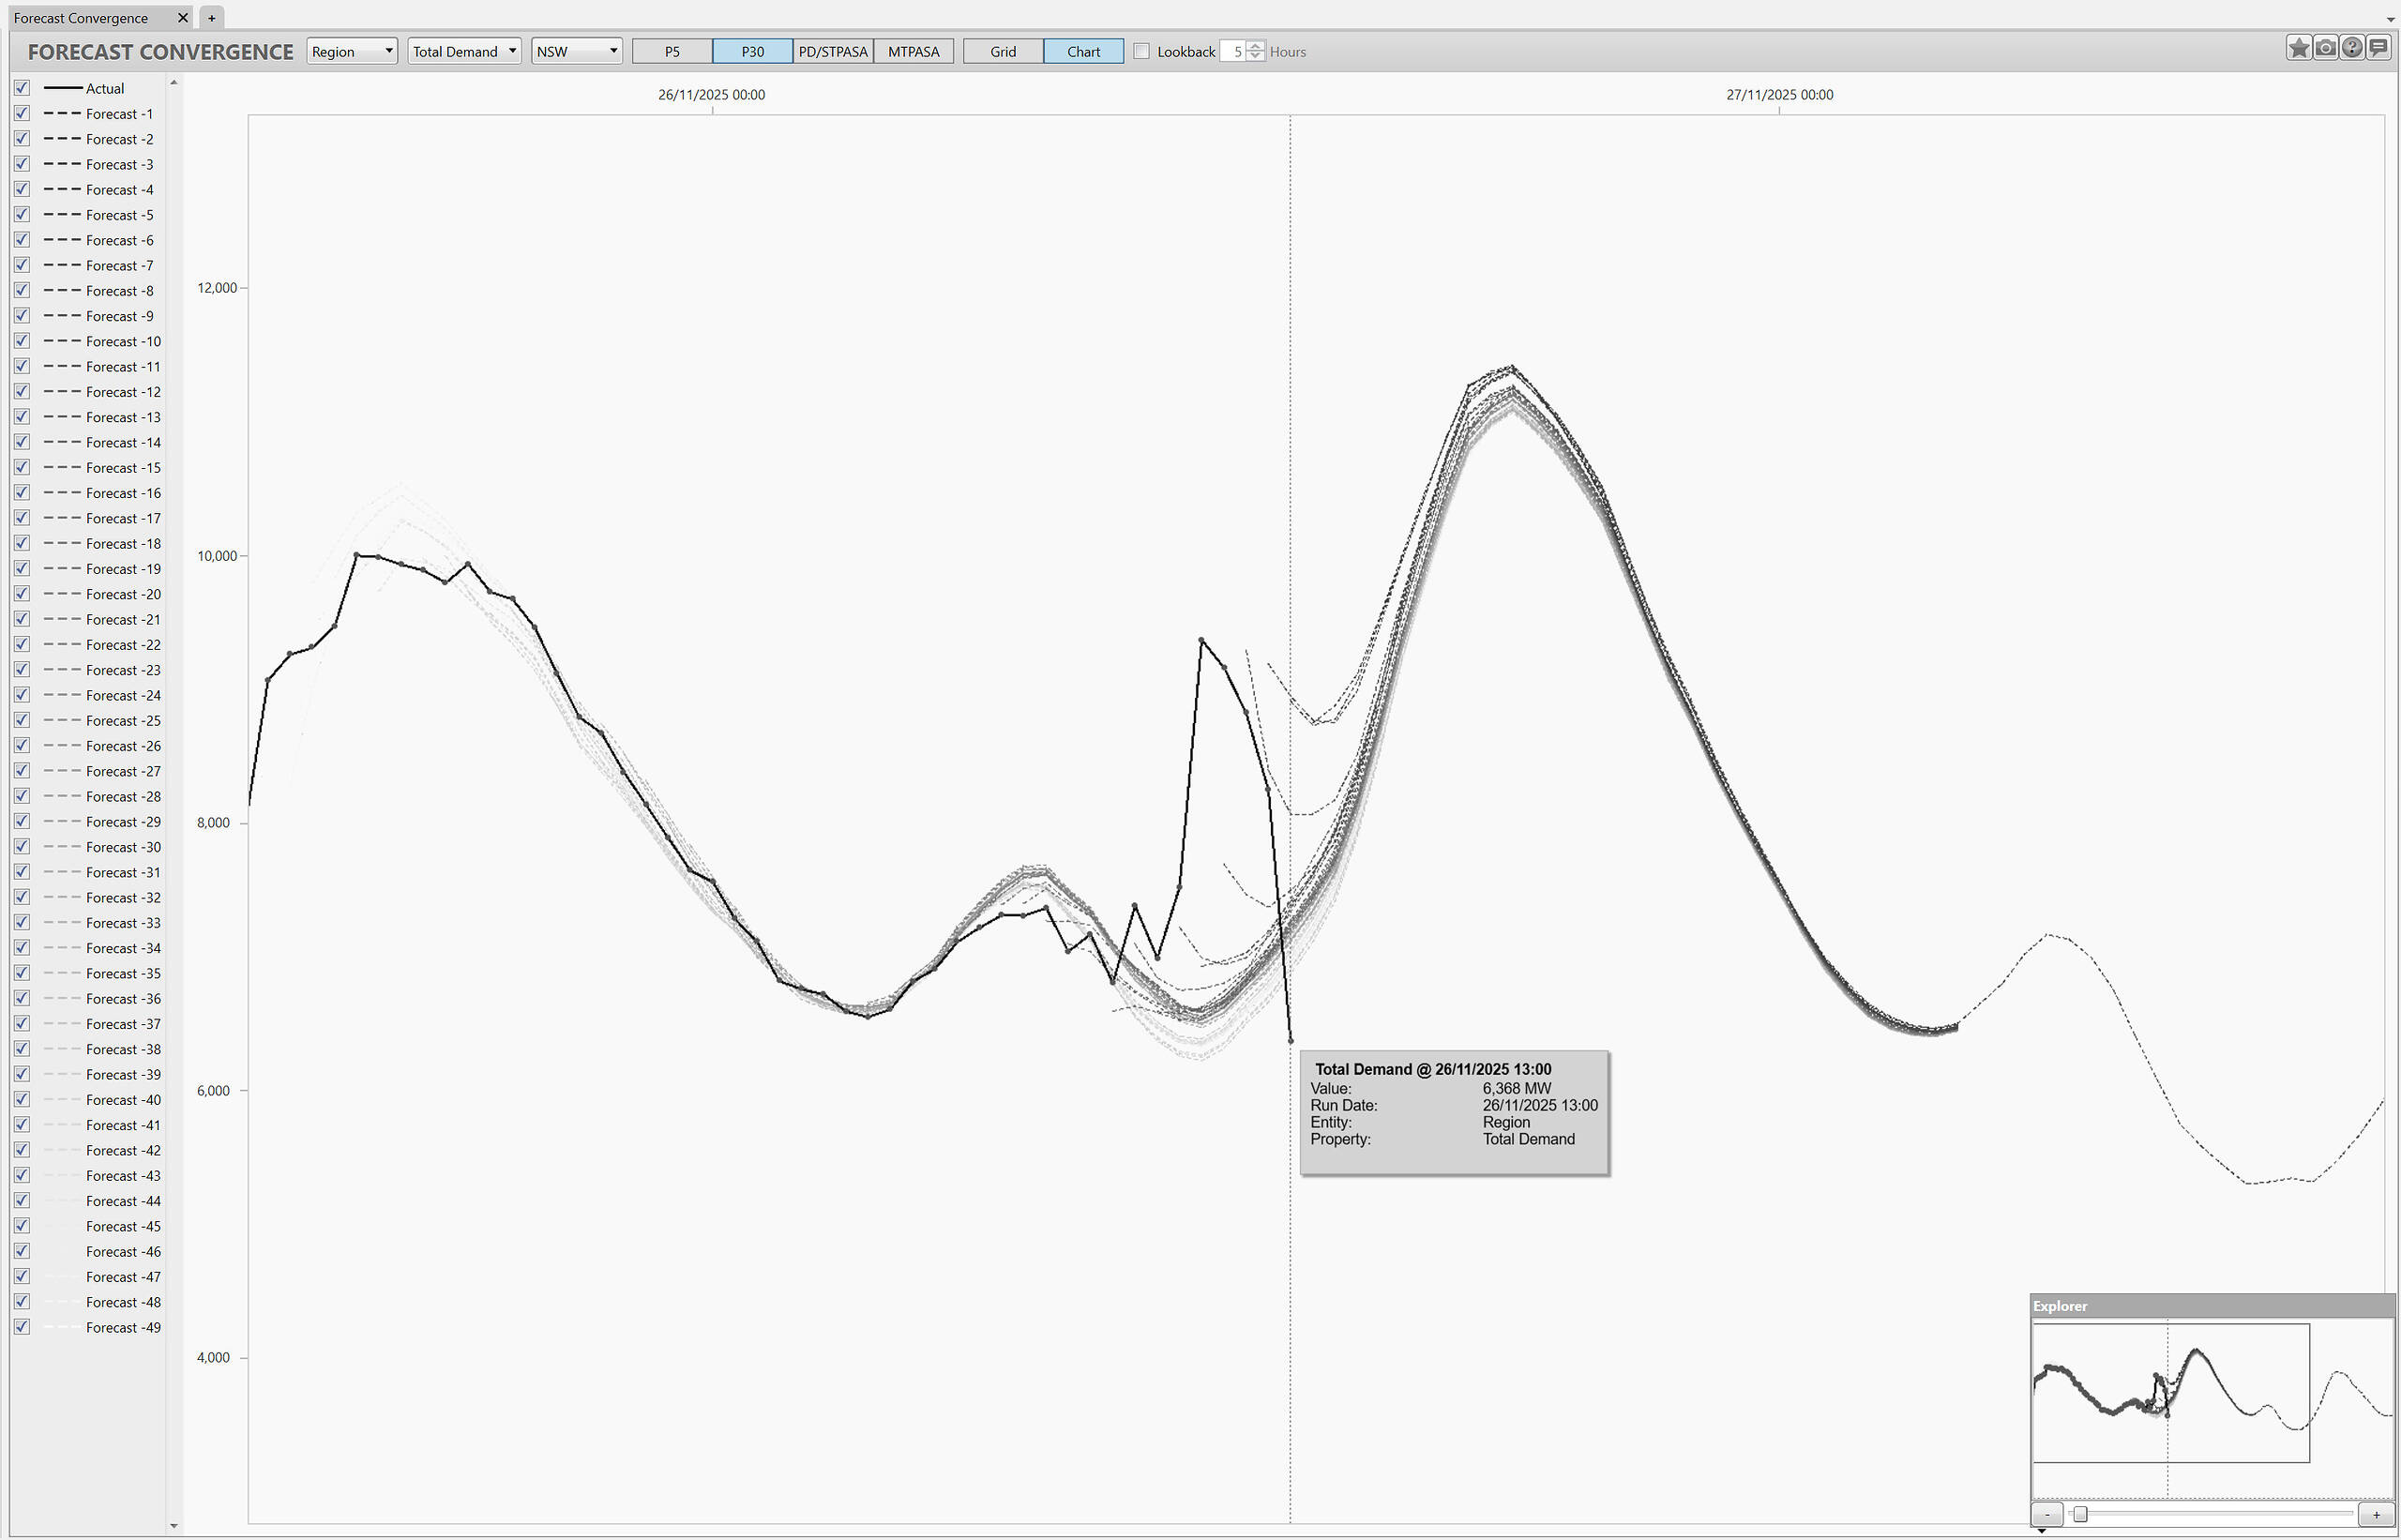
The dark solid line shows actual market demand in NSW, whilst the faded dotted lines shows each prior P30 forecast – highlighting the challenging conditions today for the AEMO’s operational forecasting team.
Source: ez2view’s Forecast Convergence Widget. Screenshot taken at 1:00pm NEM time.
As we can see in this chart, by the early afternoon actual demand values begun to land lower than earlier forecasts.
Weather
The day began quite warm in NSW, with the temperature at Sydney Airport already above 30°C by 8:30am NEM time (9:30am local time), before cloud cover and storms moved in and eased conditions just around 12:00pm NEM time.
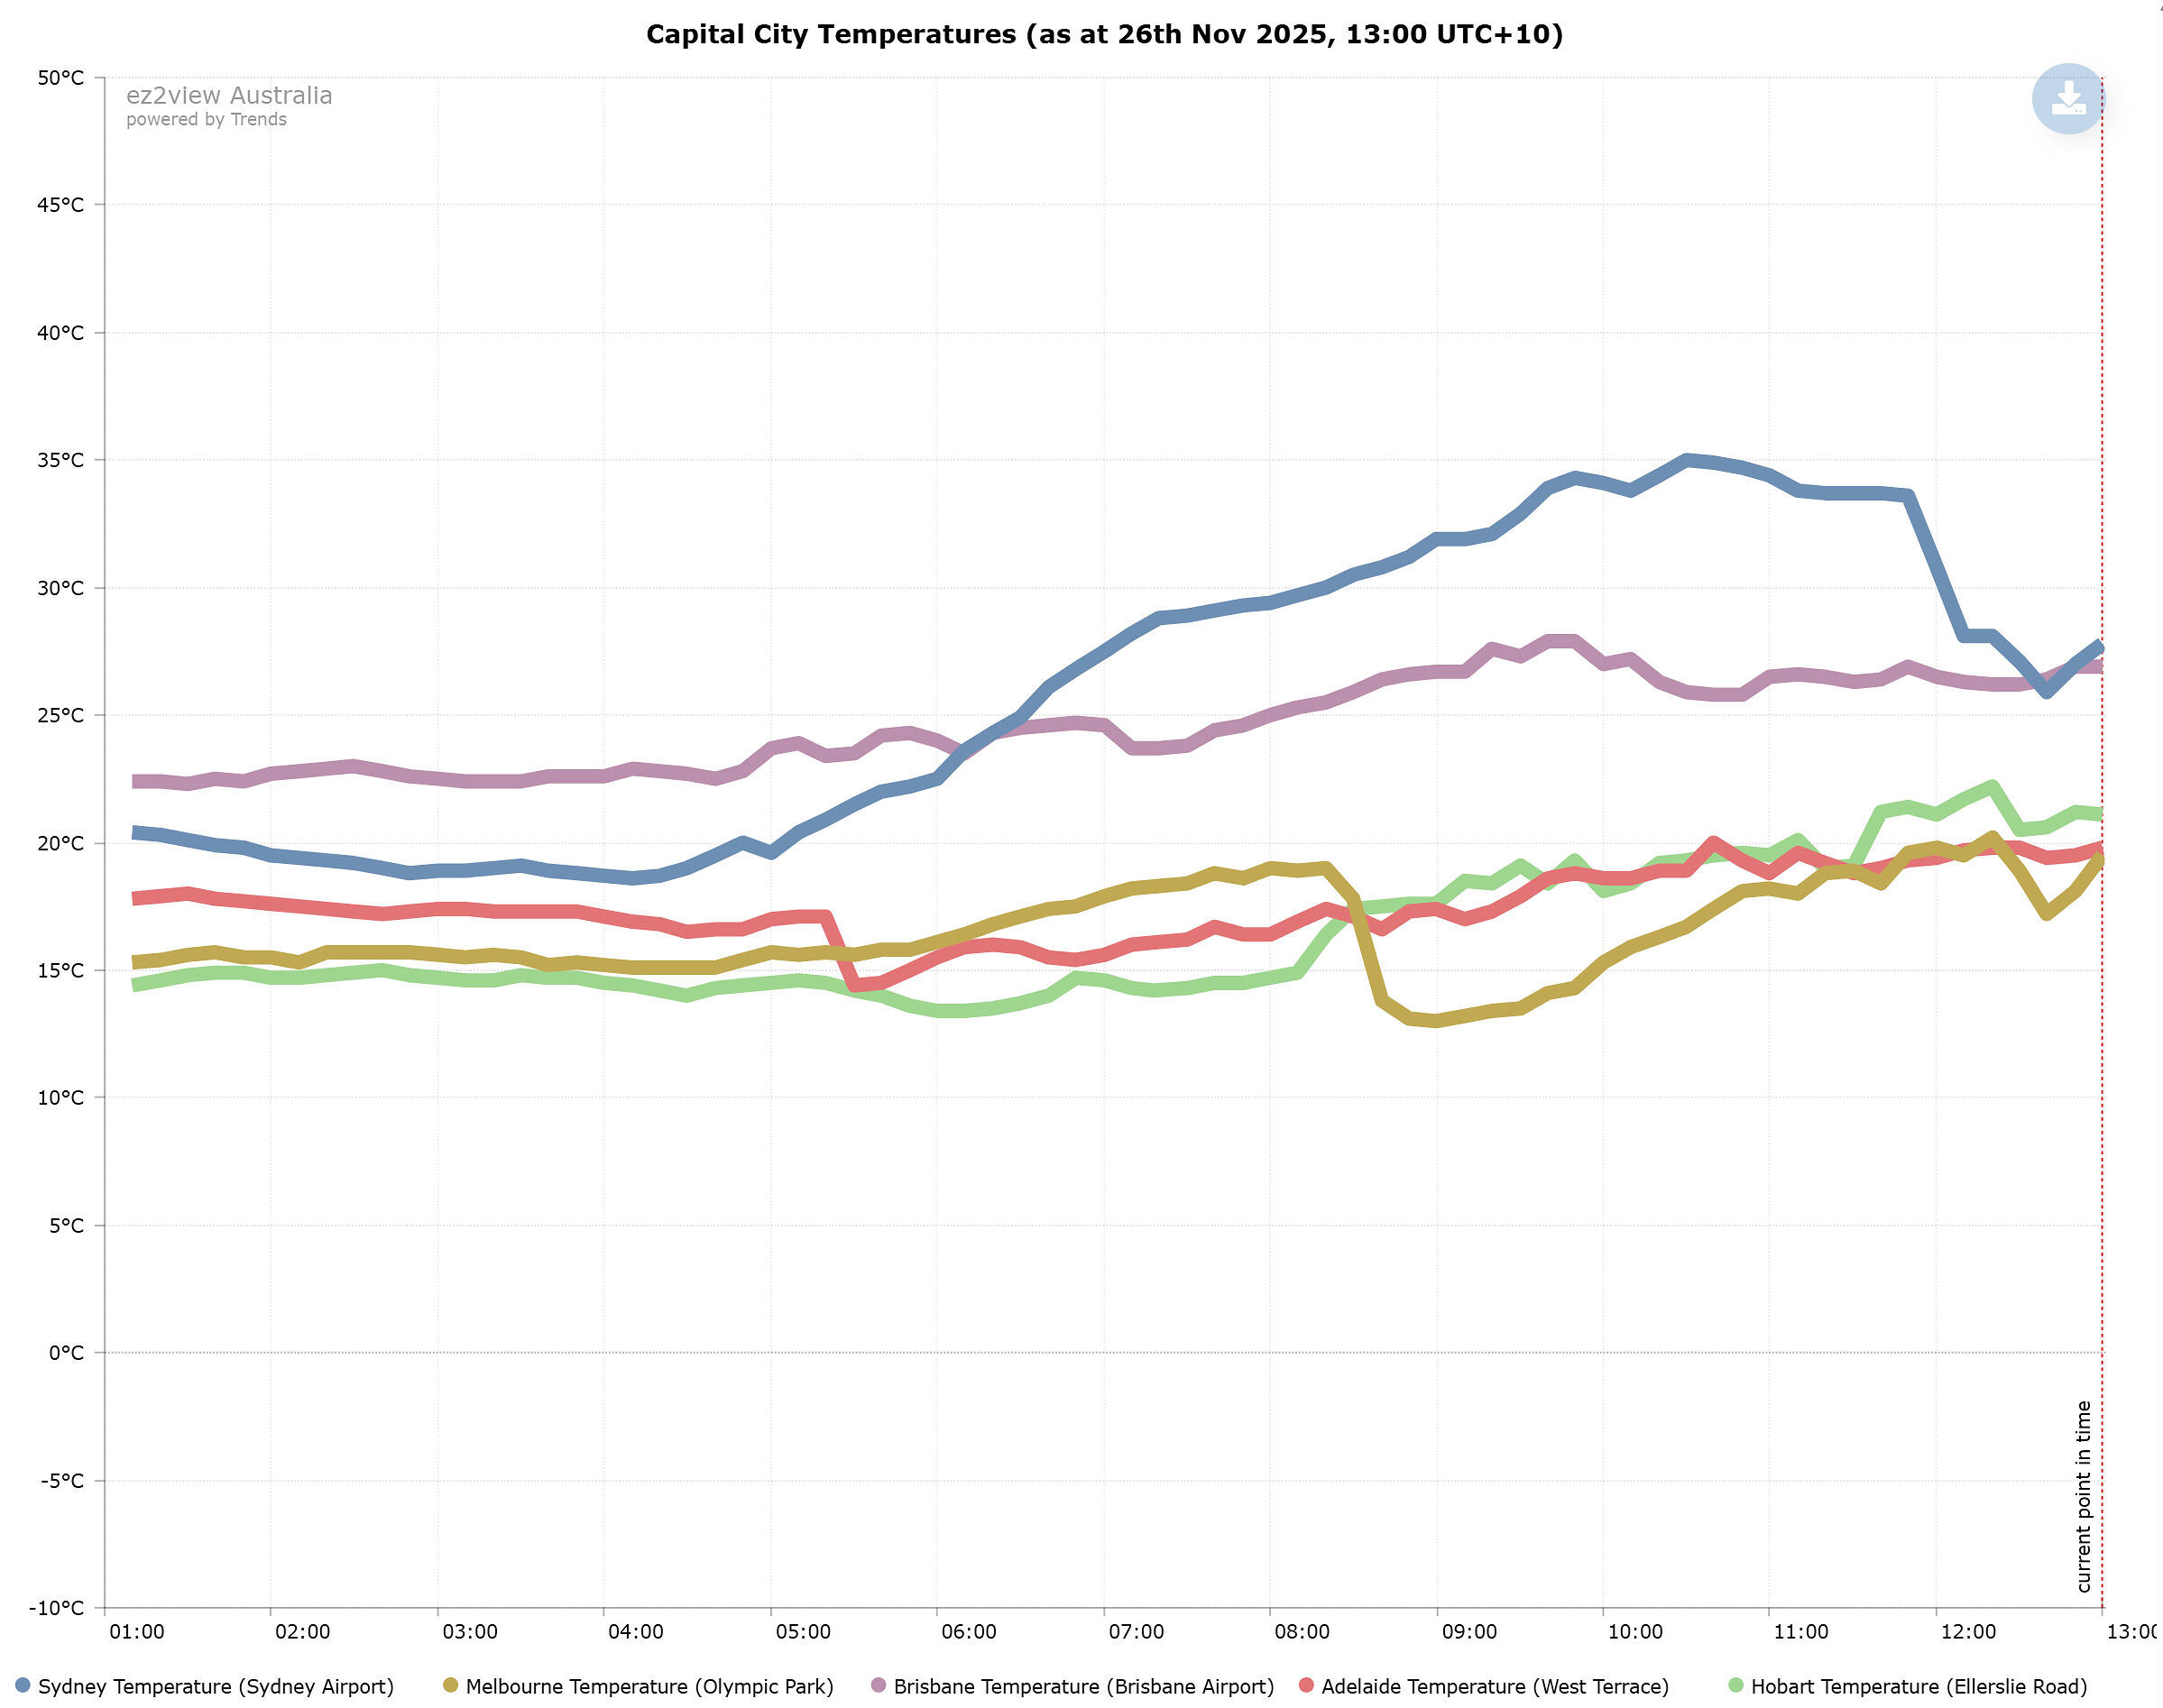
Source: ez2view’s Trend Editor Widget. Screenshot taken at 1:00pm NEM time.
The thick, fast-moving storm cells moved east across central NSW toward Sydney, bringing localised cloud cover, rain, and rapidly fluctuating solar output. For around a 15 to 45 minute period, the cloud band appears to have heavily reduced rooftop PV generation before the cooling effect from the storm arrived, contributing to that sharp, temporary spike in net demand.
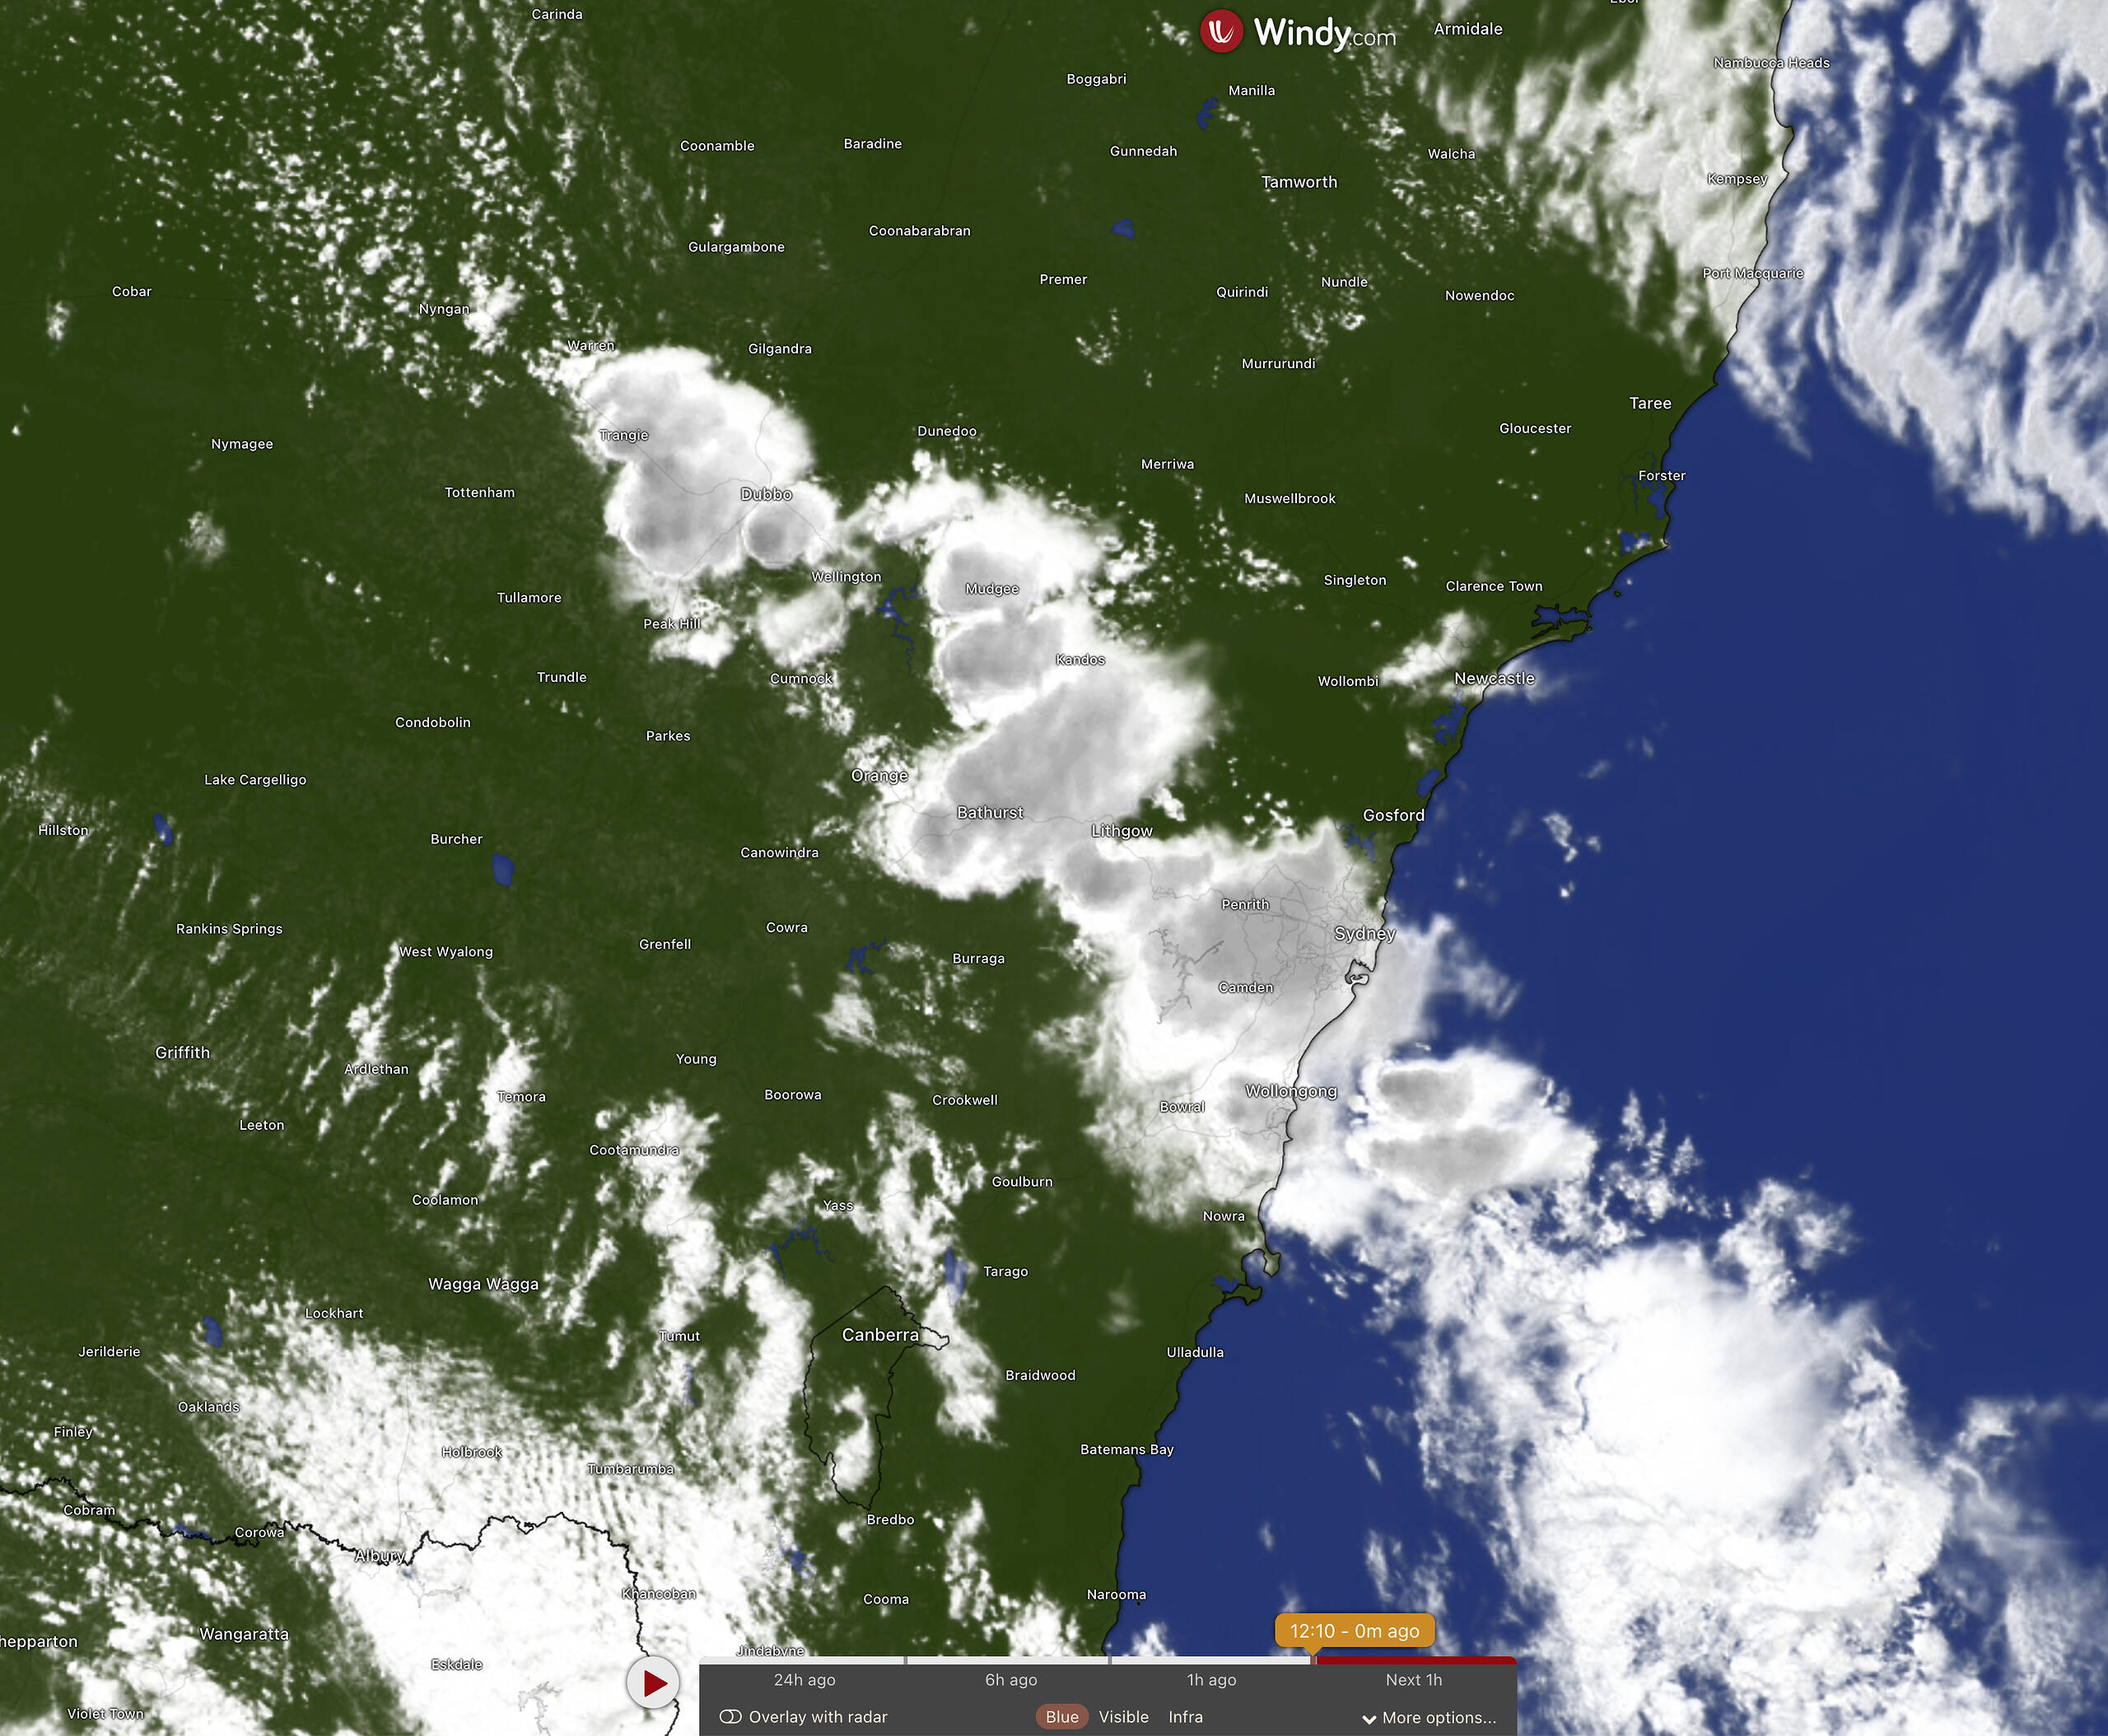
Source: Windy. Screenshot taken at 11:15am NEM time.
As the storm moved east it appeared to have impacted parts of the distribution network across central and northern NSW, with several large clusters of outages emerging on the Essential Energy distribution network around midday.
Source: Essential Energy. Screenshot as at 11:15am NEM time (12:15pm local time).
Generator Outages
On the supply side, there were a few outage-related notes worth mentioning, to help us understand how generation was positioned to respond.
Notably, the 750 MW Eraring Unit 4 returned from an extended planned outage this morning, having been offline since August 29th.
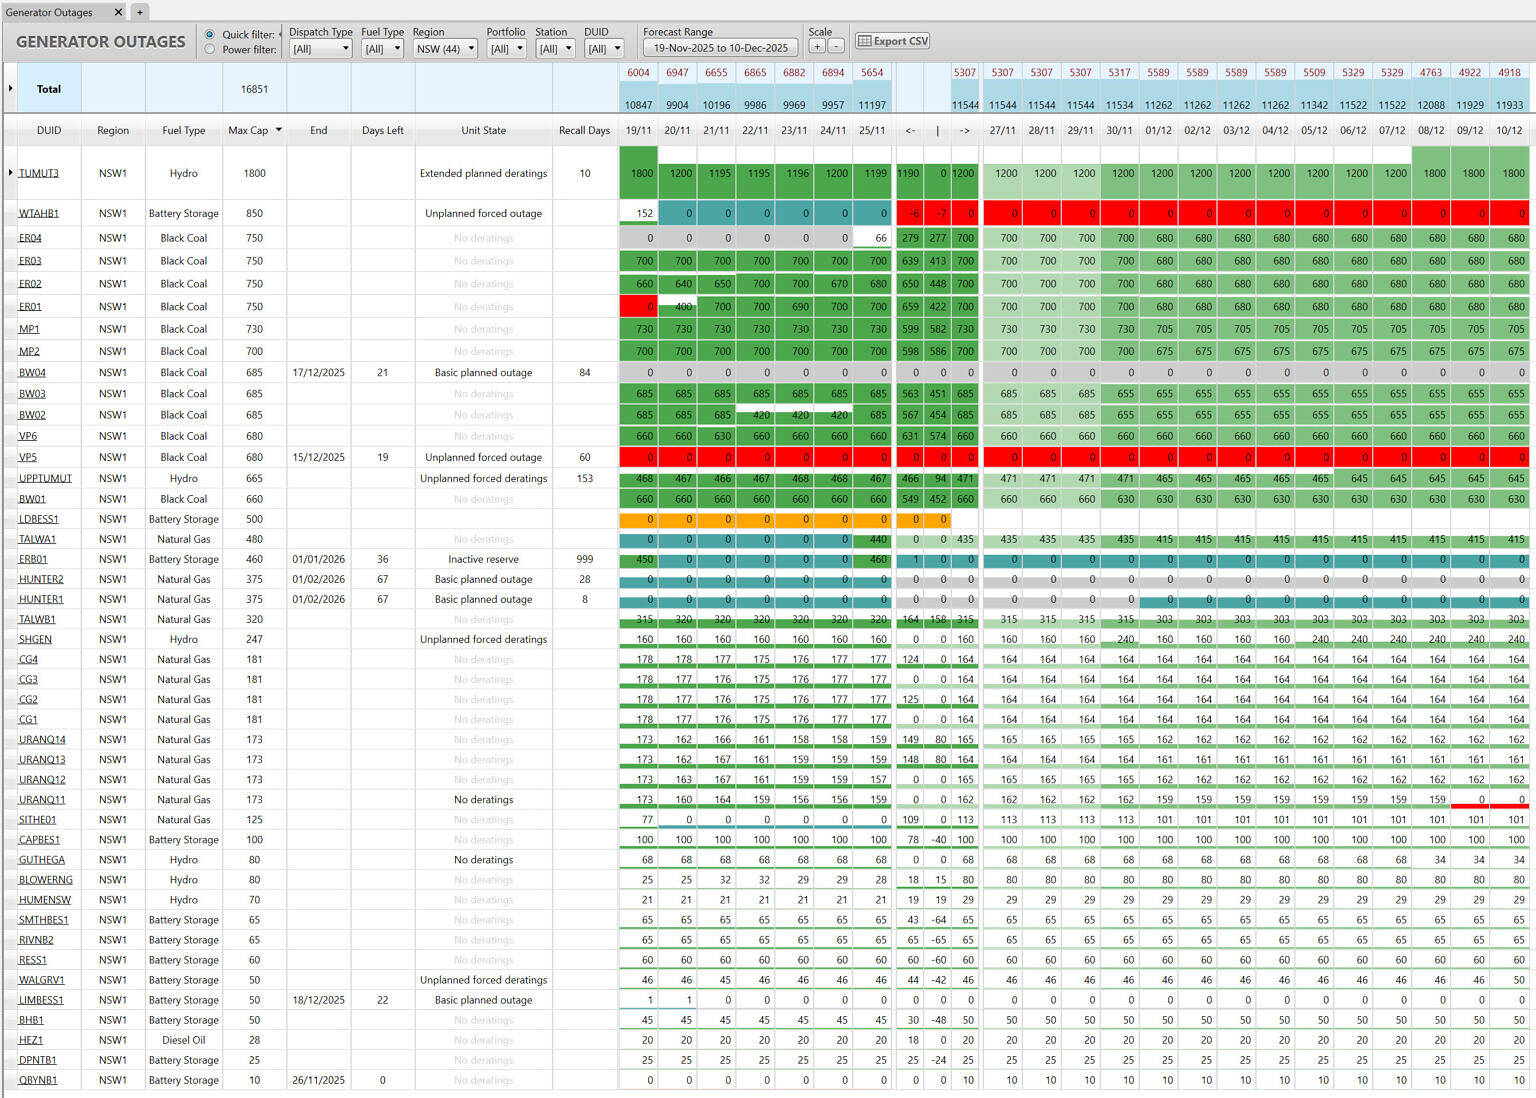
There were only a handful of long-term outages of note in NSW today, with outages/deratings seen at the Waratah BESS, Vales Point and Bayswater.
Source: ez2view’s Generator Outages widget. Screenshot taken at 1:00pm NEM time.
Current outages/deratings of interest include the 850 MW Waratah BESS, which is currently reporting that its market-portion capacity will be unavailable until May 1st 2026 following a well-publicised transformer incident last month. My understanding is that the battery’s capacity reserved for the SIPS scheme is not reported through the MT PASA process (and therefore does not appear in the screenshot above). However, RenewEconomy reported on Sunday that the battery is currently not providing SIPS services, and won’t be until December 2nd due to ‘scheduled maintenance’. It was not clear in that reporting as to whether this maintenance was scheduled prior to the transformer incident.
In the screenshot above we can also see longer-term outages at the 685 MW Bayswater Unit 1 and the 680 MW Vales Point Unit 5, both of which are still weeks away from their planned return to service.
Interconnector Flows
Just like yesterday, this morning we saw some heavy counter-price flows on VNI, with NSW exporting into VIC even through prices were more than $20,300 higher in the former. A Negative Residue Management (NRM) constraint kicked in at the 11:05 dispatch interval to clamp VNI flows back towards NSW.
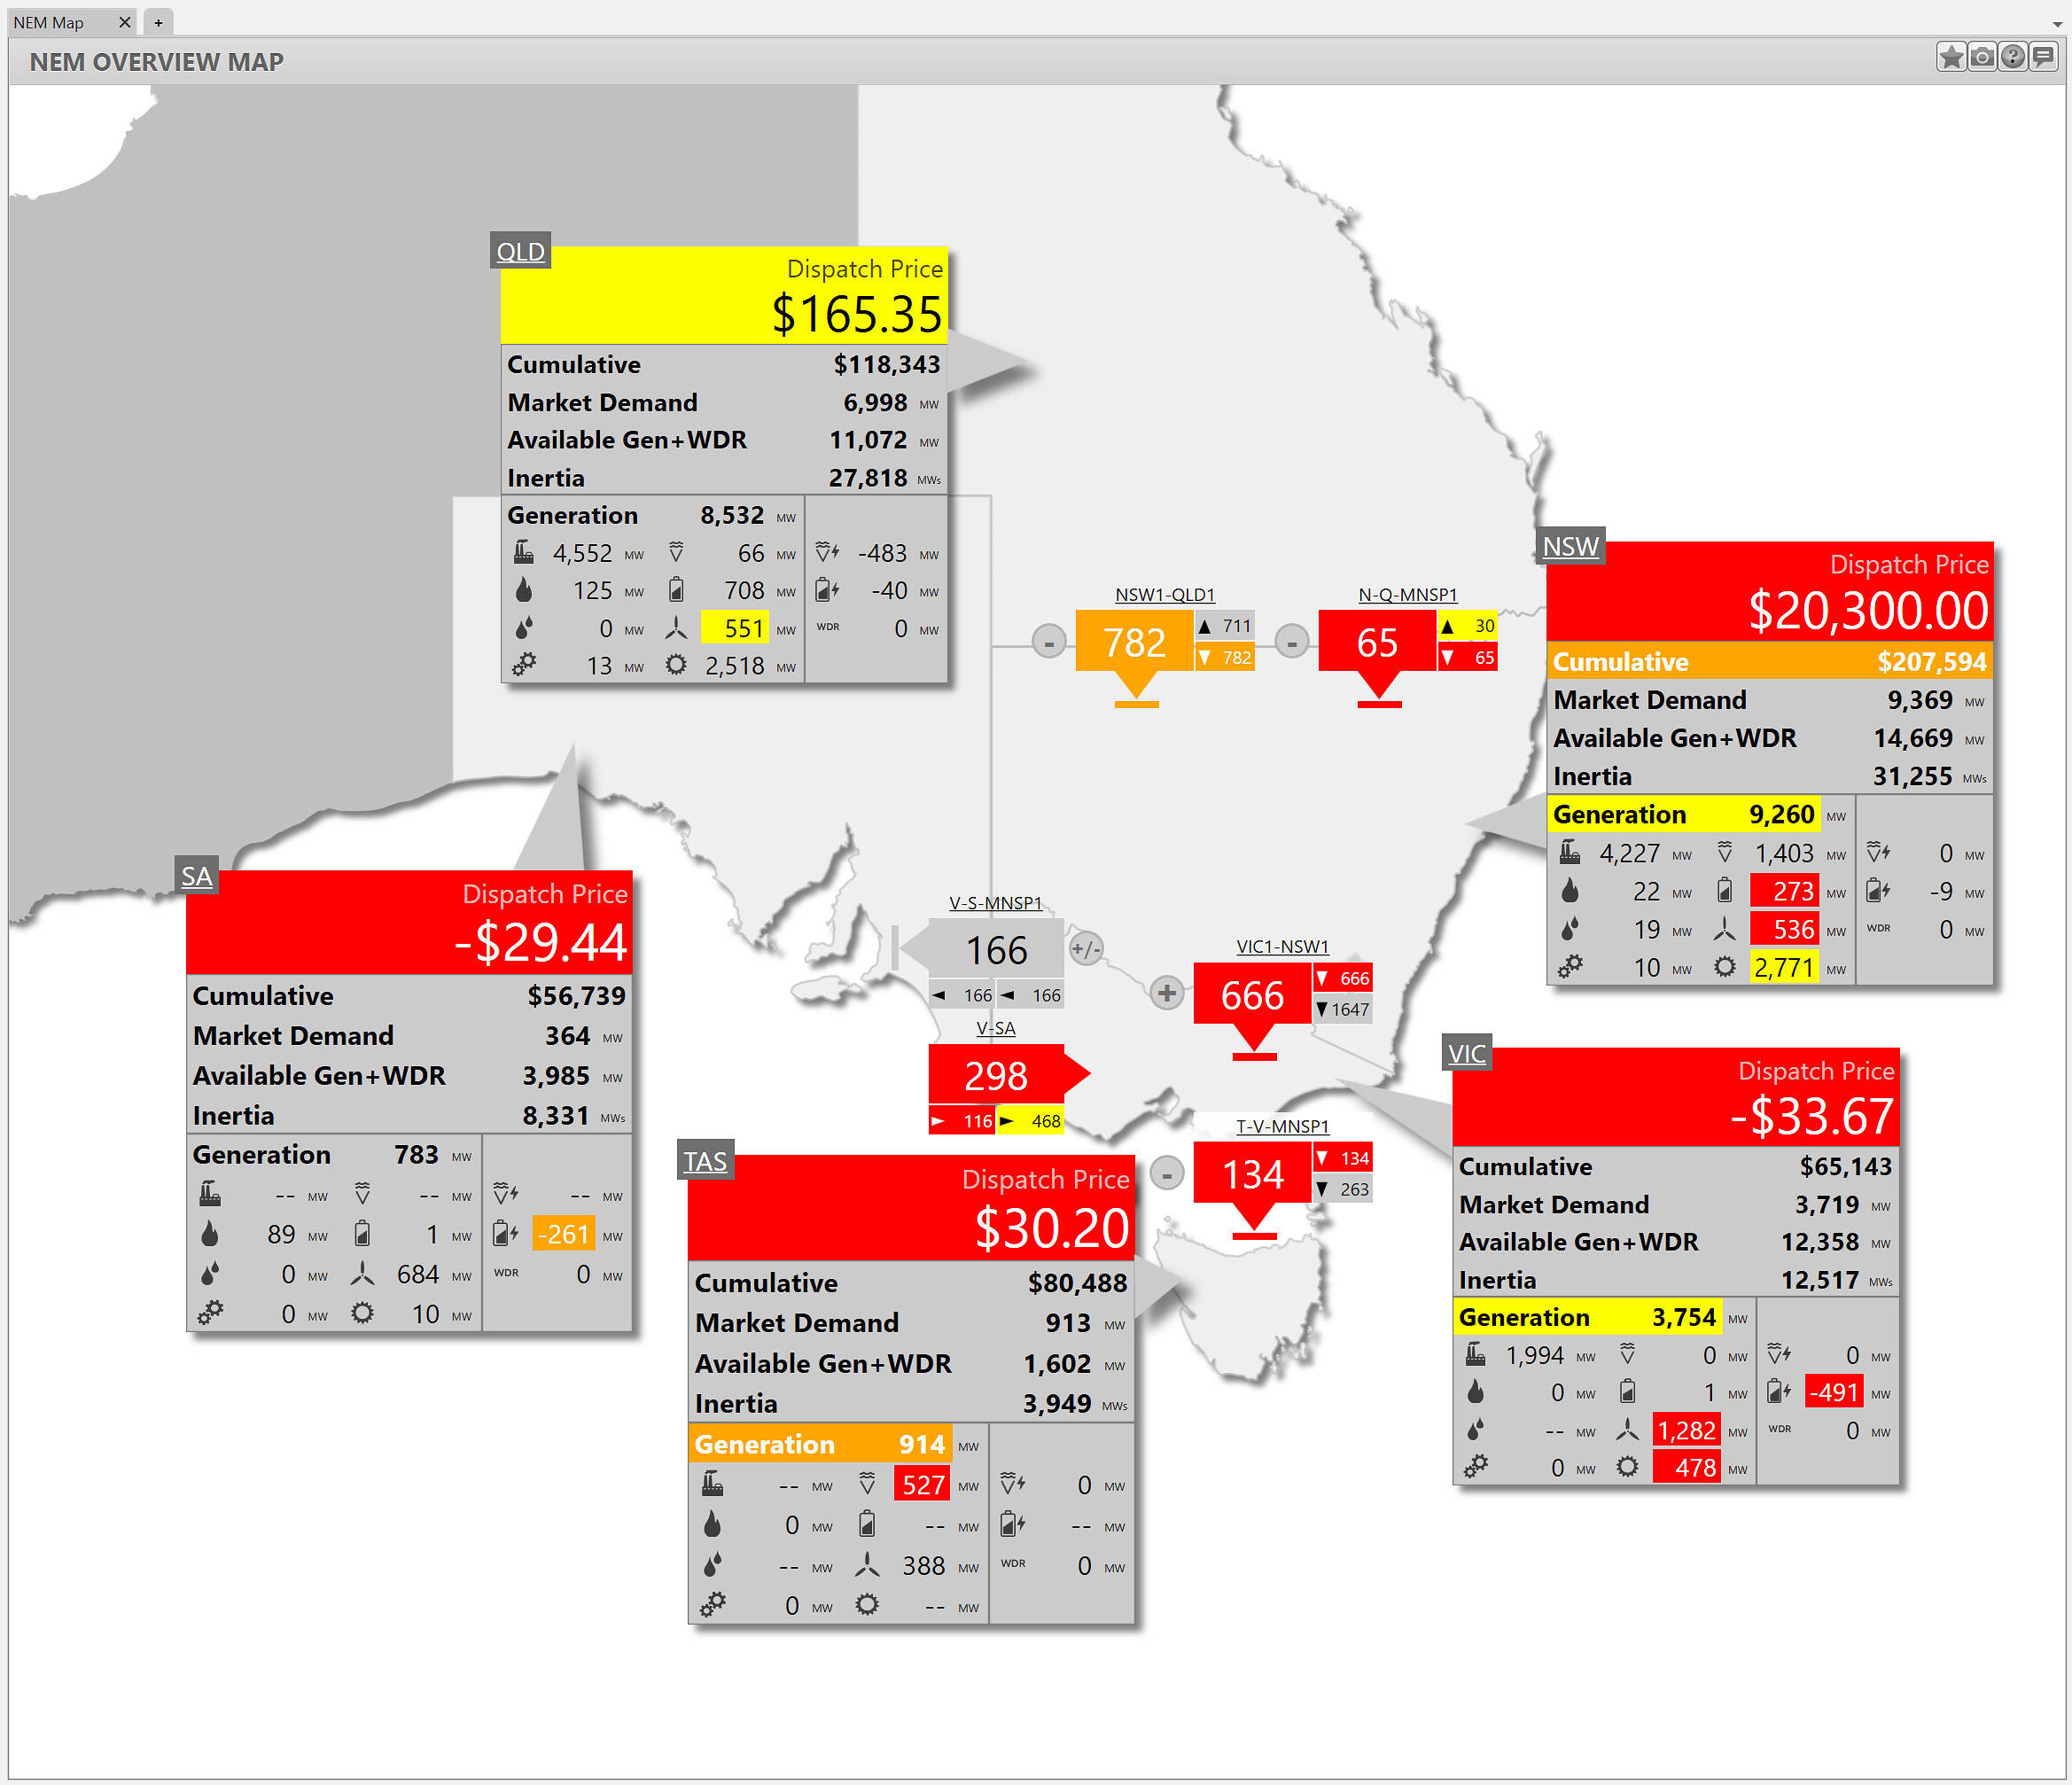
Source: ez2view’s NEM Map Widget. Screenshot taken at 11:00am NEM time.
From a quick review of the interconnector data I can see that an NRM constraint was setting the import limit on the VNI interconnector for a period between the 11:05 and 12:35 dispatch intervals. Interestingly, an NRM constraint was also in play for QNI between 12:05 to 12:55, briefly setting the export limit at different points within that period.
Curtailment and Constraints
With prices plunging deep into negative territory during the afternoon, it’s likely that some economic curtailment (i.e. offloading) occurred across NSW’s Variable Renewable Energy (VRE) fleet, as is relatively typical during daytime hours in the NEM these days.
More notably, during the 20-minute window when prices were at or near $20,300/MWh, more than half of semi-scheduled VRE availability in NSW appears to have been curtailed — indicating that a substantial amount of network-driven curtailment was occurring.
Ordinarily we would use individual unit availability to estimate curtailment more accurately, but that data is not published by the AEMO in real time. Instead, the two charts below compare the regional wind and solar Uncontrained Intermittent Generation Forecast (UIGF) for NSW against the aggregate output of each fleet to provide a simple, indicative view of how much curtailment was occurring throughout the morning period when the price spike occurred.
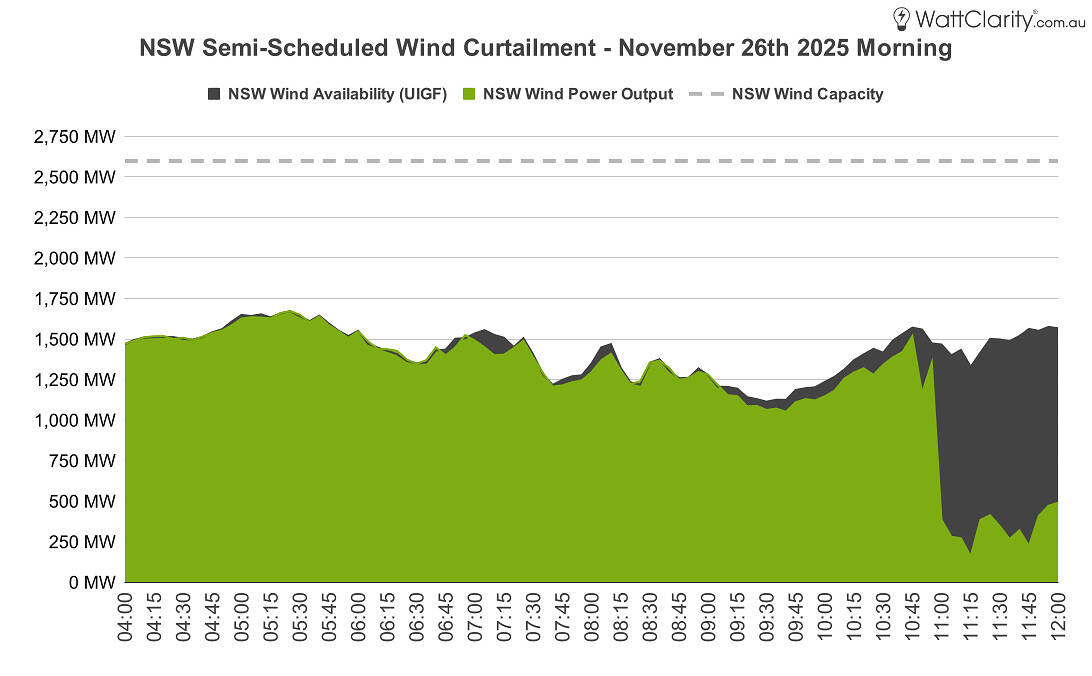
Source: NEMreview. Timestamps are in NEM time.
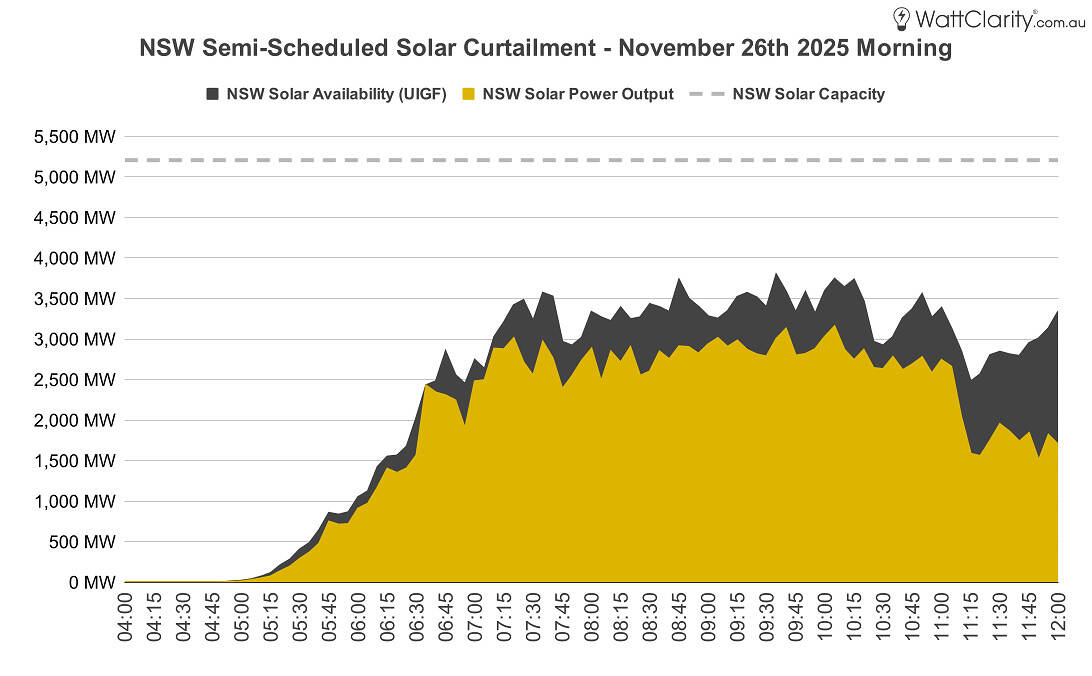
Source: NEMreview. Timestamps are in NEM time.
To unpack this a bit further, below is a screenshot from our congestion map widget in ez2view (taken for the 11:10 dispatch interval).
We can see that the physical dispatching price in NSW reached $34,532.33/MWh — well above the MPC. While bids/offers themselves cannot exceed the MPC, the physical dispatching price (i.e. the raw dispatch price) can exceed it when binding constraints force the dispatch engine to combine volumes from both very high-priced and very low-priced bands to meet the marginal MW. In these situations, the constraint trade-offs can result in an effective marginal price that is a multiple of the highest bid band. (By contrast, prices are directly set by constraints only when a constraint is violated and its penalty factor enters price-setting.)
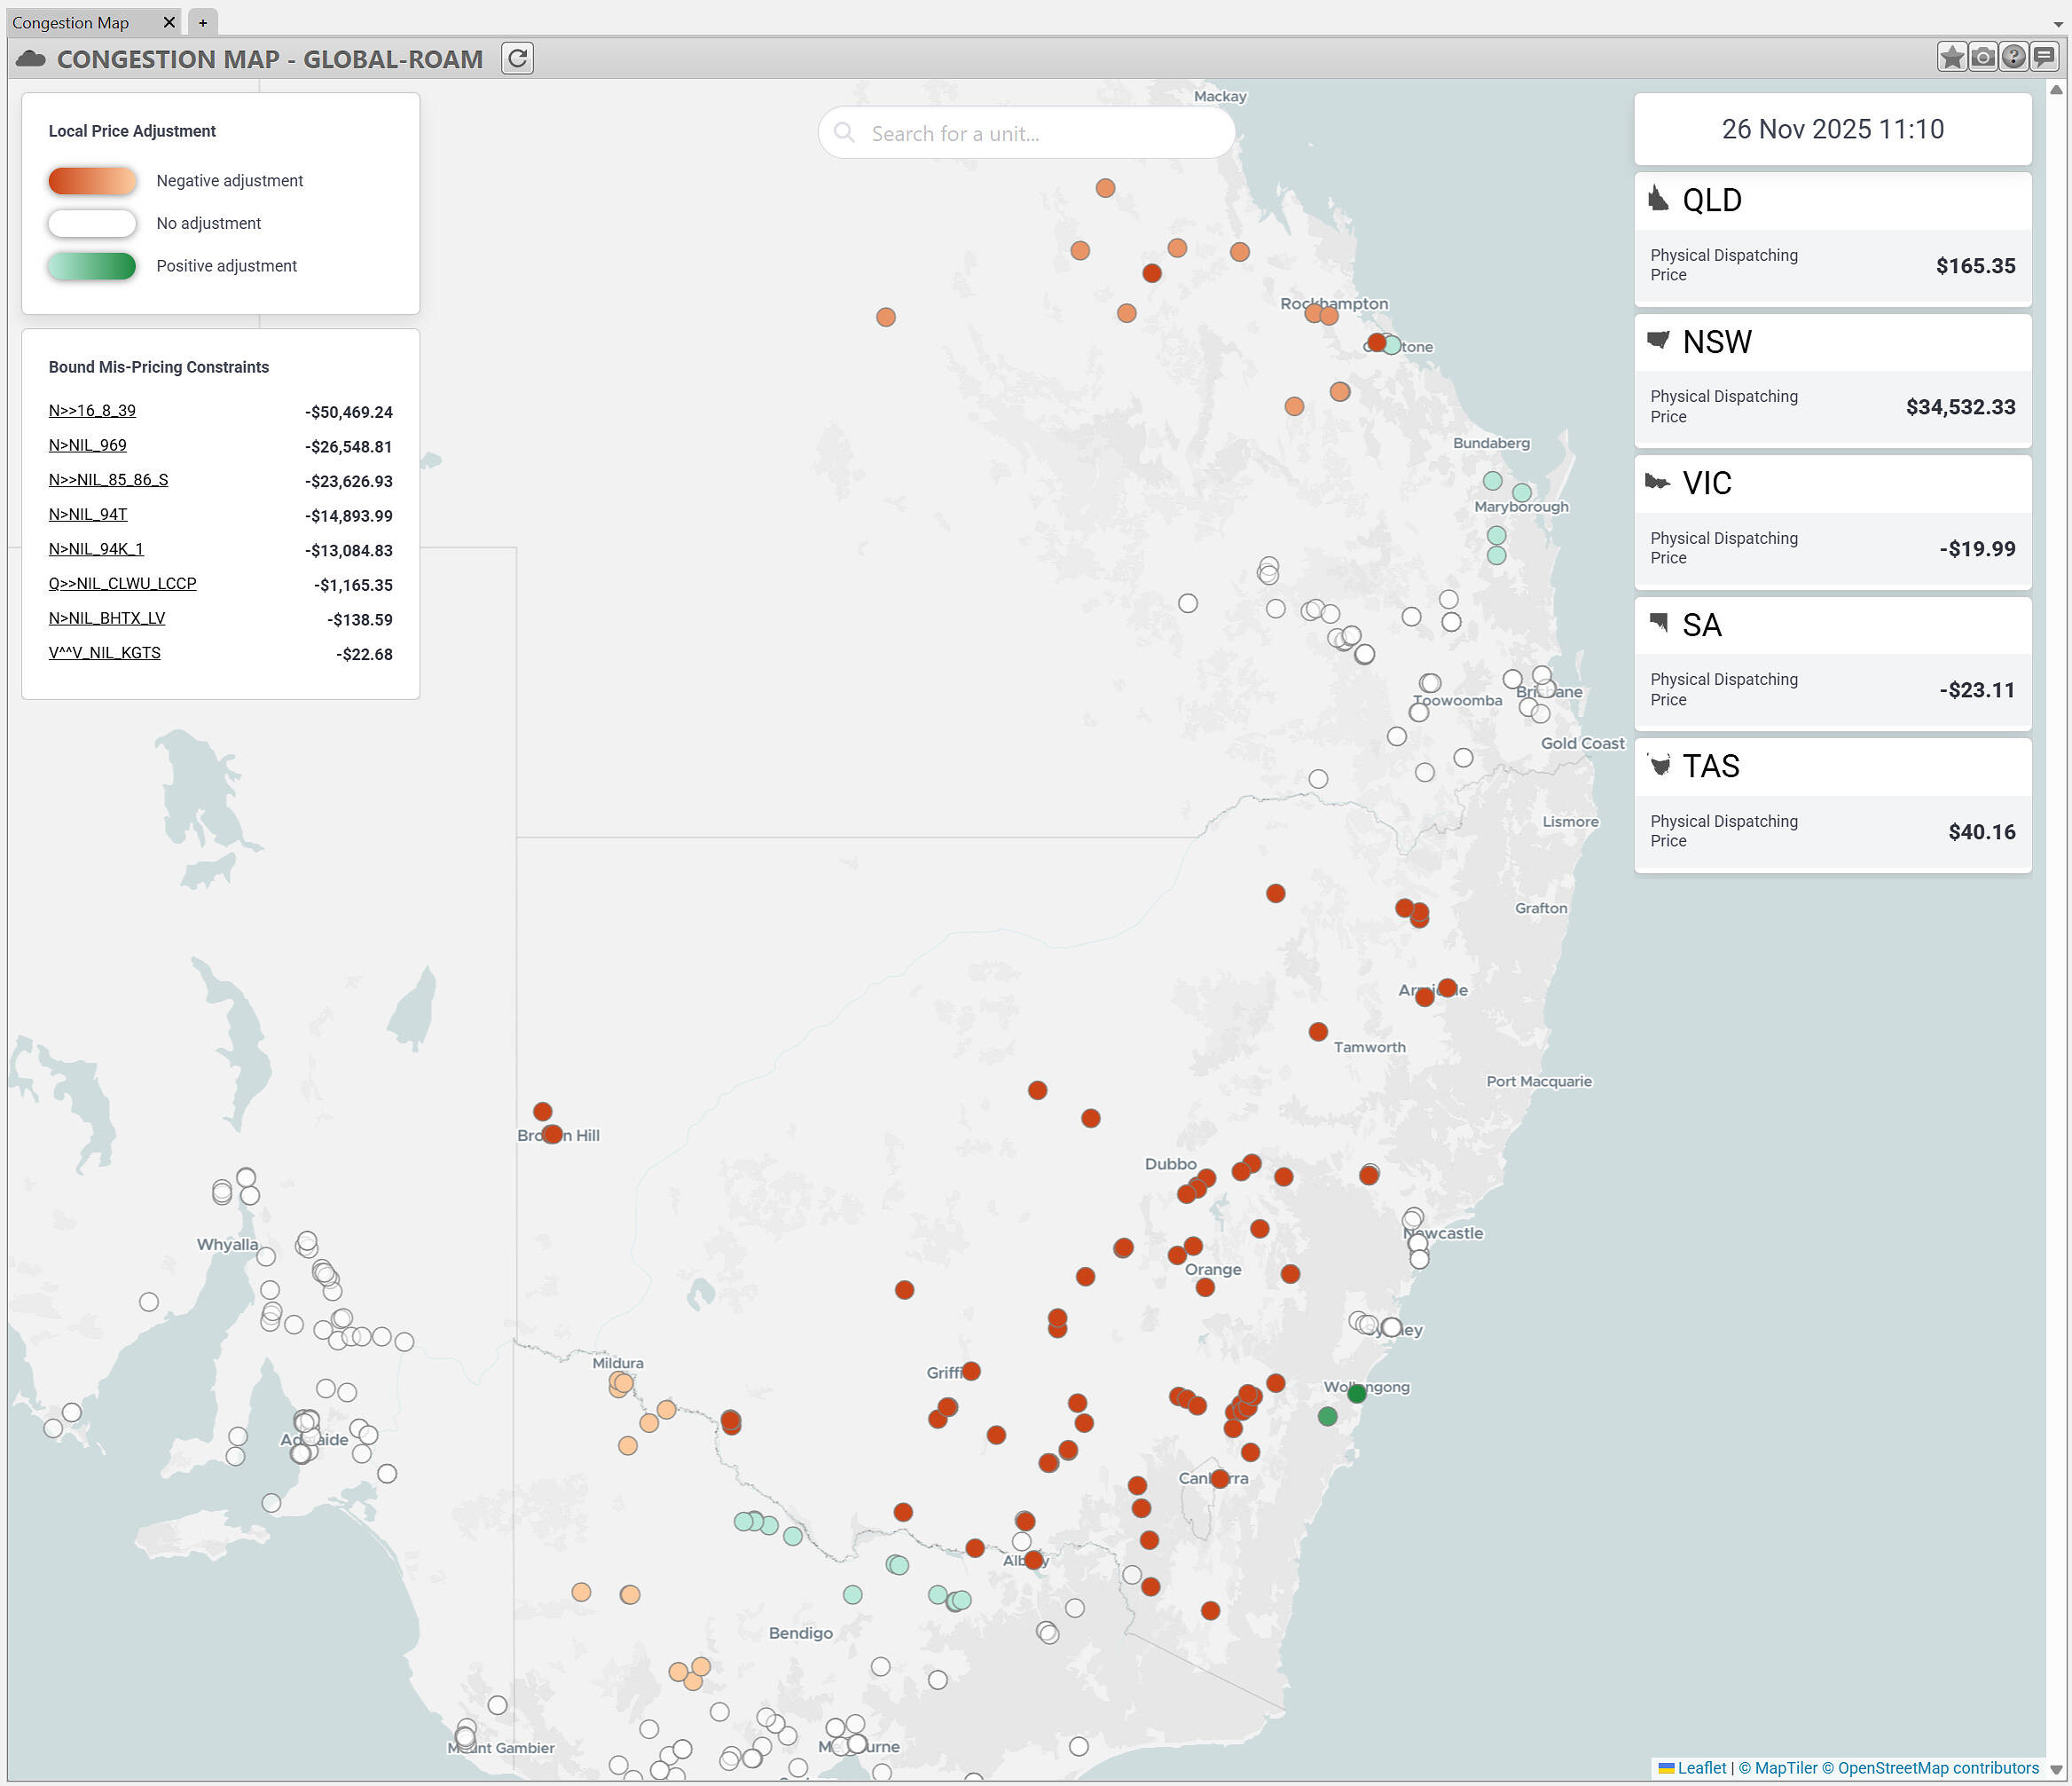
Source: ez2view’s Congestion Map Widget. Screenshot taken at 11:10pm NEM time.
From the screenshot it is worth highlighting five constraint equations that are binding with marginal values beyond -$10,000 during this interval, as this helps us understand some of the main constraints impacting the market this morning:
- N>>16_8_39 — A thermal constraint invoked due to an outage on the Avon–Marulan 330 kV line. The constraint equation includes almost every unit in NSW outside of the greater Sydney and Newcastle areas, and a small number of others.
- N>NIL_969 — A system normal thermal constraint affecting a handful of units in Northern NSW, north of Tamworth.
- N>>NIL_85_86_S — A system normal thermal constraint affecting units around Armidale and to its north and west.
- N>NIL_94T — A system normal thermal constraint that commonly binds, and affects a number of units in Central NSW.
- N>NIL_94K_1 — A system normal thermal constraint, and affects a number of units between Dubbo and Rye Park.
Given that the unexpected demand surge appears to have been driven by a sudden drop in rooftop PV output across Sydney and the surrounding metropolitan areas, it’s not surprising that a range of constraints bound to limit how generation was dispatched in the inverse section of the region — particularly with the ramping limits on the thermal plants located closer to these load centres, and the transmission outage noted above.
—
Today’s events leaves plenty of threads to pull on, and we’ll aim to dig into them further as more data becomes available and as/if time permits — including network flows, rebidding patterns, battery behaviour, ramping limitations, and other contributors to the volatility.
It looks to me like the lack of battery capacity close to Sydney contributed to the delay in pushing the price back down. There was only a 250MW increase in battery output at the time of the price spike on Wednesday, which was insufficient to cover the increase in demand in the Sydney region. Of course the lack of transmission capacity within NSW was setting this situation to play out, then dramatically compounded it when the demand spike occurred. Clearly relying on only one large BESS close to Sydney is not looking like an optimal solution. Even at full capacity the Waratah Super Battery would not have fully handled this sudden change in supply.
I think the implementation of the Negative Residue Management (NRM) constraints needs to be reviewed. The current process is producing unnecessary supply/demand shocks on the grid, which often occur at times when the grid is under strain. It would make far more sense to stage the introduction the NRM constraints over several intervals to avoid the shocks to the grid.
On NRM constraints, 1) they do cut in progressively, IIRC they don’t try to cut back counterprice flow by more than 100 MW per dispatch interval; 2) they don’t reduce supply available to the high price region, since they target reduced exports out of that region.
You write that “The rapid movement of clouds can cut rooftop PV output with little notice — and because this generation is largely invisible to the market operator, it adds another layer of uncertainty to their forecasting models.” but a reasonable proxy for that data is available via the large and growing network of home weather stations that measure and report insolation.
For example have a look at the Ecowitt map at https://www.ecowitt.net/home/map drill down to my weather station at https://www.ecowitt.net/home/index?id=168614 and you can clearly see the history and realtime data for insolation. Aggregate this up by postcode with a multiplier for estimated rooftop panel capacity and you are in business!
The web site will even provide the data in tabular format and you can export it. To automate this would be a very small project that could yield a relatively reliable forecast model.
Nice writeup Dan
I reckon you’ll find that the sudden curtailment of wind and solar shown in your charts will coincide with Snowy rebidding a lot of its Tumut generation capacity down to MFP in order to dispatch against the high spot price. By 11:15 those generators were running at over 1,600 MW, having been at 0 MW until 10:45. They sit lower in the firing line of the 16_8_39 constraint than some of the southern NSW wind and solar generators, which would have been first cabs off the curtailment rank.