Already, after the events of Thursday 16th October 2025 (in which the frequency trended lower through the afternoon, ending up below the NOFB ), we’ve progressively been delving further …
- On the following day:
- We highlighted the ‘Weakness in frequency stability on Thursday afternoon 16th October 2025’ (Part 1)
- And then we posted ‘Peeling the second layer of the onion, with respect to the (SemiSched-induced) frequency weakness on Thursday 16th October 2025’ (Part 2)
- On Monday this week:
- We invested a bit more time with ‘Taking a first focused look at the 16:50 dispatch interval on Thursday 16th October 2025 (with frequency dropped below NOFB) … Part 3’.
So in this follow-on (a Part 4 in this Case Study, if you like) we’ve taken some steps further in striving to understand.
Briefly recapping what we’ve learnt to date
Across the three articles above, we’ve learnt the following – with respect to calculated Dispatch Error for significant units on the day:
1) In Part 1 and Part 2 we uncovered that there were 4 identifiable Events, as follows:
| Dispatch Interval
(and Event #) |
Frequency Trend | Contributions (positive and negative) |
|---|---|---|
| 13:35
(Event 1) |
During this dispatch interval (with the trips of YWPS3 and YWPS4):
|
We know that YWPS3 and YWPS4 combined for a positive Dispatch Error of approx +600MW (i.e. harmful) The beneficial impacts were:
Thankfully at this time, no other fuel type had a (harmful) positive Dispatch Error (which will be the reason why frequency was brought under control so quickly). |
| 15:10
(Event 2) |
During this dispatch interval, the frequency trended down, with the low point being 49.865Hz:
|
Unfortunately, the combined effect of Semi-Scheduled VRE in this dispatch interval was quite harmful to frequency stability:
Offsetting these harmful effects, was:
|
| 15:25
(Event 3) |
Approximately 15 minutes after the low point above, the frequency had rebounded (a little too far):
|
In this case we see:
On the flip side, those dragging the frequency up (a little too far) were:
|
| 16:50
(Event 4) |
During this dispatch interval, the frequency trended down, with the low point being 49.824Hz at 16:49:07.6:
|
Unfortunately, the combined effect of Semi-Scheduled VRE in this dispatch interval was even more harmful to frequency stability:
Offsetting these harmful effects, was:
|
2) In Part 3, we focused specifically on ‘Event 4’ … because that seemed, to us, to be the most significant:
(a) Both with respect to what happened on that day;
(b) But also with respect to increasing concerns about whether the Semi-Scheduled category (as it currently operates) is sustainable or scalable.
… as a result of which we identified the following:
| Solar Farms
(Semi-Scheduled) |
Wind Farms
(Semi-Scheduled) |
|
|---|---|---|
|
All Units |
An aggregate Dispatch Error of +422MW |
An aggregate Dispatch Error of +422MW
|
|
Large Dispatch Errors |
There were 6 units that had (unhelpful) Dispatch Error >+40MW:
… but also one unit with a helpful deviation (in QLD) Of the 6 units with unhelpful deviations:
So with the Solar Farms in this instance, the cause appears to be a collective weather issues.
|
There were 6 units that had (unhelpful) Dispatch Error >+40MW:
Of these:
So with the Wind Farms in this instance, the cause appears to be a collective technical challenge. |
|
Remaining Units |
Of the remaining 101 Solar Farm units:
The causes of these (larger number of) smaller deviations have not been investigated.
|
Of the remaining 78 Wind Farm units:
The causes of these (larger number of) smaller deviations have not been investigated. |
Delving further, with the 4-second data
Remember that the NEM has operated for many years with 4-second data as one of the common building blocks of operations management in the NEM.
1) In anticipation of the commencement of Frequency Performance Payments from 8th June 2025 (and the Non-Financial Obligation ~ 6 months earlier), the EMMS Data Model was upgraded (with v5.4) late in 2024 to include the 4-second data as standard.
2) We have a fairly extensive history of this data set prior to this time – but it’s become easier to work with from v5.4 forwards.
Caveats and Cautions to remember…
Before presenting the results, readers should keep in mind the following caveats and cautions:
1) The 4-second data comes from operational SCADA systems on site, and is time-stamped at the point when received by AEMO at the other end:
(a) i.e. not when the SCADA data was actually captured;
(b) So at times (e.g. especially during ‘busy/interesting’ times – such as when many alerts are triggering) the lag can be quite material.
2) In the charts below, you’ll see that none of the 13 units selected follow their interpolated Targets precisely:
(a) Which speaks to both:
i. the underlying and enduring challenges of the forecastability of VRE resource availability
ii. coupled with in the case of the wind farms, when (it appears) such vagaries are further complicated by plant physical constraints (e.g. in the control systems)
(b) None of what follows should be read to suggest that any of these units did anything wrong (including against the NEM Rules).
i. Readers should remind themselves of the looser requirements imposed on Semi-Scheduled units compared to their fully Scheduled cousins;
ii. Especially about the differences when Semi-Dispatch Cap flag is set, and when its not
iii. And the (relatively recent) changes made as a result of the AER Rule Change.
(c) Rather, in this evolving Case Study is being prepared as a result of our deepening curiosity about increasing role such large collective deviations are playing on frequency performance (and potentially underlying system security).
(d) From a mathematical point of view, readers should note the difference between:
i. The ‘Dispatch Error’ calculation used in Part 2 and Part 3 – which was done for the end of each dispatch interval (only) and resulted in positive numbers representing under-performance; and
ii. The ‘Deviation_MW’ calculation shown here in this Part 4 … which is:
> calculated for each 4-second dispatch interval
> utilising the reverse direction of calculation (i.e. so negative numbers here are under-performance)
> and using the interpolated Target-to-Target trajectory (used for FPP), rather than the InitialMW-to-Target trajectory (used for other aspects of Dispatch)
With these cautions in mind, let’s progress….
The 7 x Solar Farm DUIDs with large Dispatch Error
We’ll start with the 4 units in NSW and then the 2 units in South Australia (all unhelpful in this Dispatch Interval) before showing the 1 unit in QLD that had a large helpful contribution:
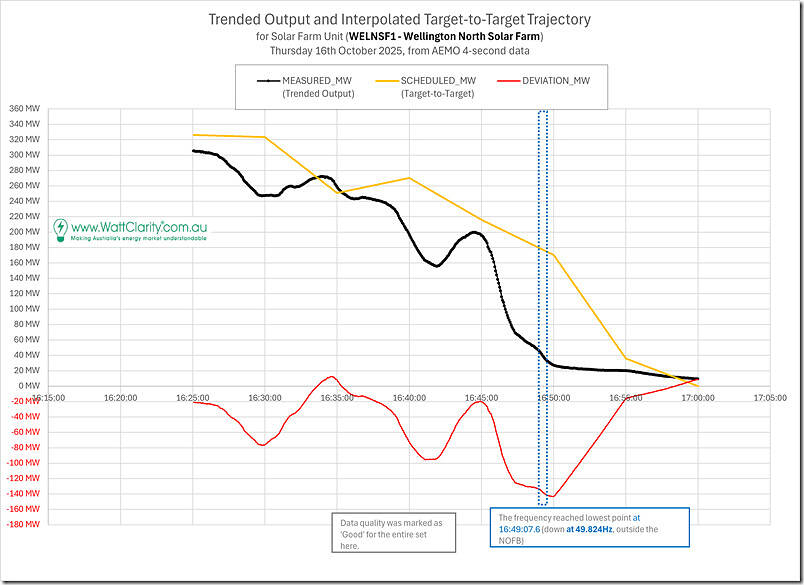
NSW Solar Farm (WELNSF1, where Dispatch Error = +143MW)
Here’s a view of the Wellington North Solar Farm – with a particular focus on the the low point (being 49.824Hz) at 16:49:07.6 … towards the end of the 16:50 dispatch interval:
In this case, we see that the unit output (the black line) loosely follows the Target-to-Target trajectories downwards over the 35 minute period shown, with (unfortunately):
1) the biggest deviation being from 16:45 to 16:55
2) with the largest of these negative deviations almost perfectly lining up (coincidentally) with the lowest point of frequency.
This does reinforce the hypothesis that some unforeseen cloud cover from ~16:45 during that period accelerated the ramp down of unit output, leading to a deviation that was quite large, and (from the perspective of system frequency) unfortunately timed.
In this case, it was AEMO’s ASEFS system that (it appears) failed to foresee that cloud cover effect.
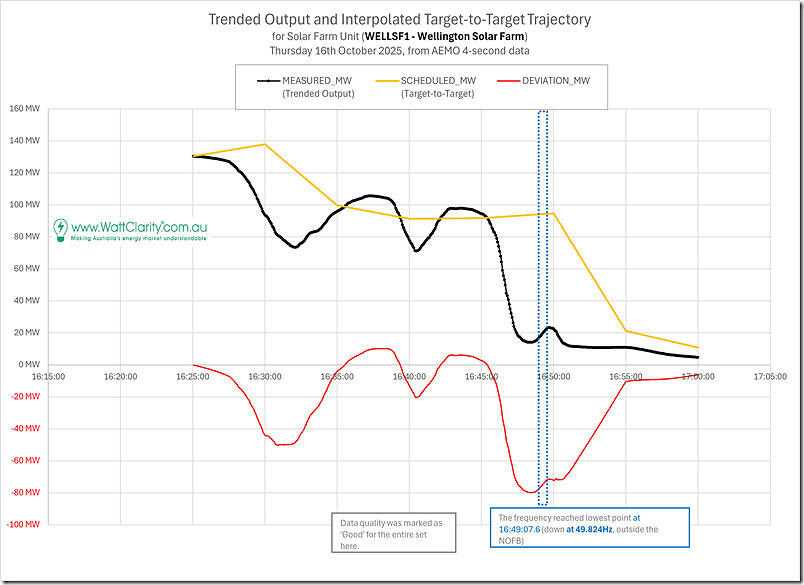
NSW Solar Farm (WELLSF1, where Dispatch Error = +72MW)
The ‘unforeseen cloud cover’ hypothesis is further reinforced when also seeing a steep drop in actual output over the period 16:45 to ~16:48 (i.e. just prior to the frequency dropping through the NOFB):
Different than the sibling solar farm, however, this (apparent) failure in factoring in the (assumed) unforeseen cloud cover was seen in the self-forecast submitted by this solar farm for the 16:50 dispatch interval.
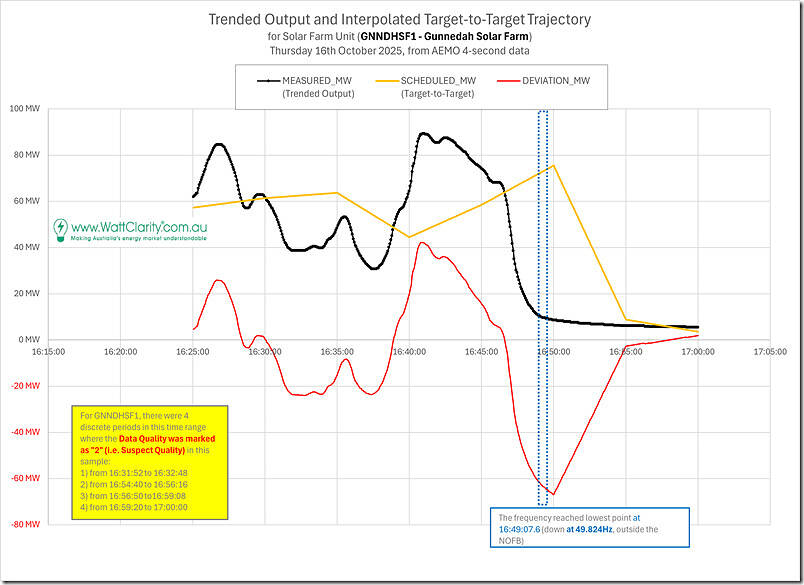
NSW Solar Farm (GNNDHSF1, where Dispatch Error = +67MW)
Now, the Gunnedah Solar Farm might be ~200km distant from the two Wellington Solar Farms ‘as the crow flies’. So not near neighbours – but perhaps located within a similar weather system.
Looking at the similarly steep drop in actual output over a similar period 16:46 to ~16:49 (i.e. just prior to the frequency dropping through the NOFB), it does make one wonder, given the similarity:
In this case (like with WELLSF1):
1) this (apparent) failure in factoring in the (assumed) unforeseen cloud cover was seen in the self-forecast submitted by this solar farm for the 16:50 dispatch interval.
2) But perhaps from a different vendor (I’ve not checked).
Note also that there were some SCADA data quality issues flagged … but not coinciding with the ramp down.
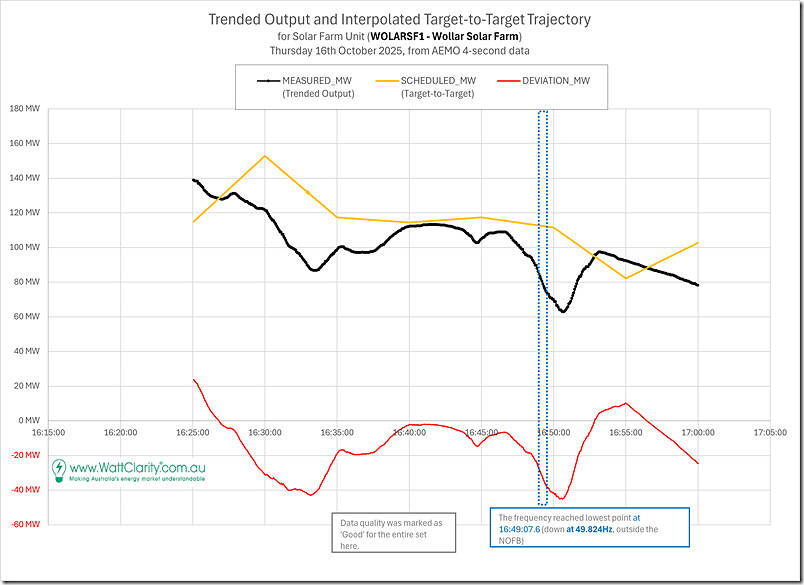
NSW Solar Farm (WOLARSF1, where Dispatch Error = +42MW)
Now, Wollar Solar Farm is closer to the two Wellington units than is Gunnedah.
But, as we can see, though there was a general ramp down (from 16:47 to 16:51) it’s not as steep as the 3 ramps shown above:
So that does make one wonder about the weather pattern prevailing through this period.
In this case, the source of the UIGF is shown in ez2view as being ‘UIGF-AEMO(FCST)’, for a change.
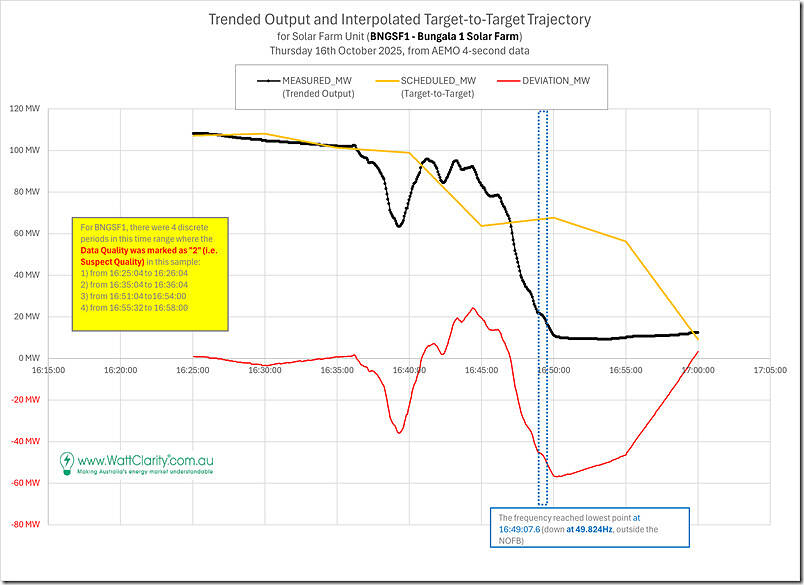
SA Solar Farm (BNGSF1, where Dispatch Error = +56MW)
Moving into South Australia, here’s a view of two siblings, starting with the older Bungala 1 Solar Farm – with a particular focus on the the low point (being 49.824Hz) at 16:49:07.6 … towards the end of the 16:50 dispatch interval (NEM time):
In this case:
1) There’s another steep reduction in output from ~16:46 to ~16:50:
(a) contrary to the slight increase suggested by the Target-to-Target trajectory
(b) or the slight decrease implied in the FinalMW-to-Target trajectory
2) and (like with WELLSF1 and GNNDHSF1) …
(a) this (apparent) failure in factoring in the (assumed) unforeseen cloud cover was seen in the self-forecast submitted by this solar farm for the 16:50 dispatch interval.
(b) But perhaps from a different vendor (I’ve not checked).
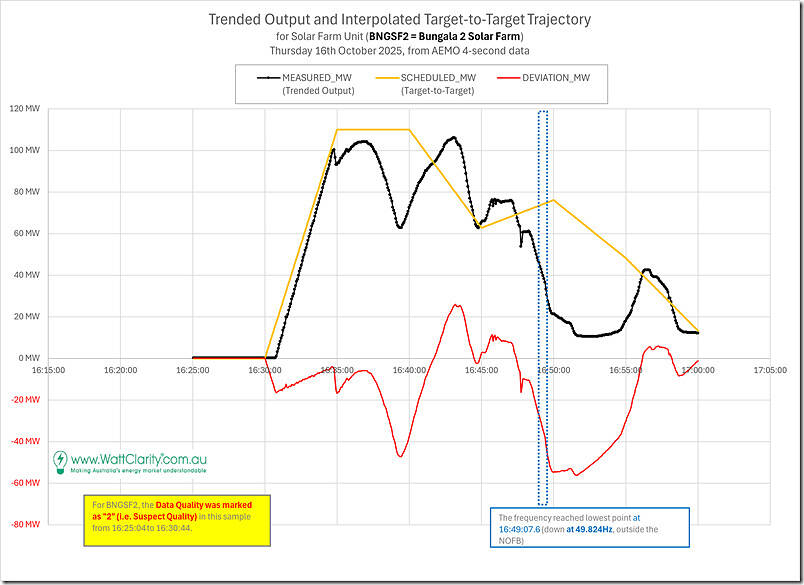
SA Solar Farm (BNGSF2, where Dispatch Error = +55MW)
Here’s a view of the neighbouring sibling (the Bungala 2 Solar Farm) which shows some similarities, but also some differences:
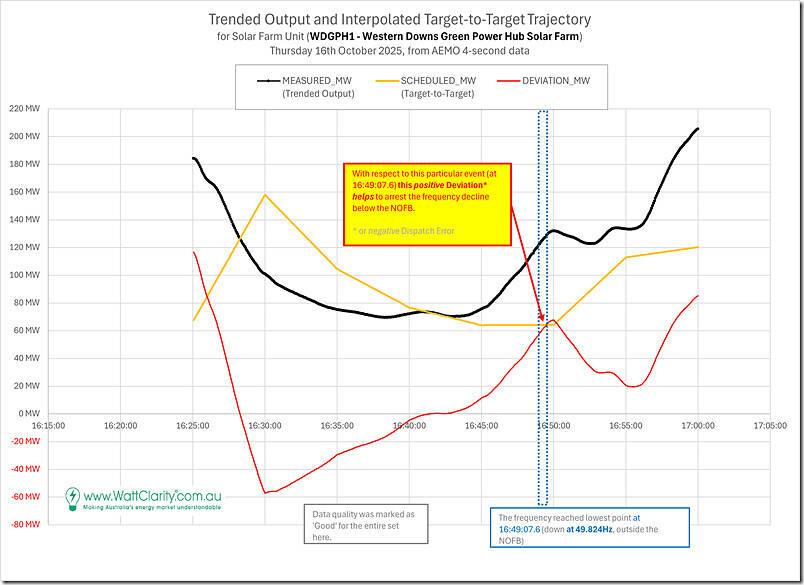
QLD Solar Farm (WDGPH1, where Dispatch Error = –68MW … helpful)
Here’s a view of the neighbouring Western Downs Green Power Hub Solar Farm – which is the unit (in this cohort) that delivered a beneficial deviation for frequency:
The remaining 101 x Solar Farm DUIDs
We’re not going to look further at the remaining 101 Solar Farms in this article (but they were discussed briefly in Part 3).
The 6 x Wind Farm DUIDs with large Dispatch Error
We’ll start with the 5 shortlisted wind farms in South Australia, and then look at the single shortlisted wind farm in Victoria (though note that the Victorian farm had the biggest Dispatch Error):
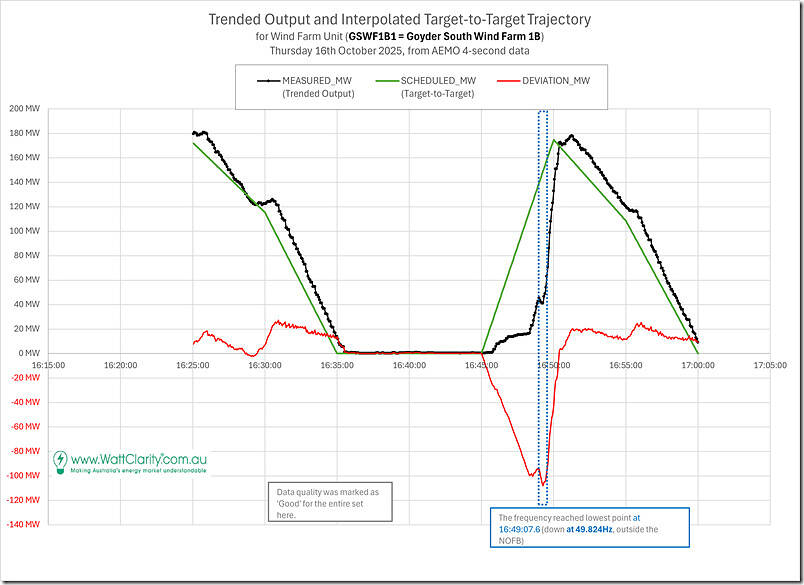
SA Wind Farm (GSWF1B1, where Dispatch Error = +52MW … unhelpful)
Here’s a view of the Goyder South Wind Farm 1B – with a particular focus on the the low point (being 49.824Hz) at 16:49:07.6 … towards the end of the 16:50 dispatch interval:
Remember (from Part 3) that this unit, and others below, were all ‘constrained off’ in preceding dispatch intervals, only to have the SDC lifted and ramps upwards assumed for the 16:50 dispatch interval.
In this case we see that:
1) The unit appeared to start within ~48 seconds of the start of the dispatch interval and slowly begin to ramp
2) But not really start to rapidly ramp until 16:48:24
3) Which meant that:
(a) Whilst it was only ~20 seconds late to reach its target
(b) The non-linear ramping made for a Deviation of ~-106MW at the time of the low point in system frequency.
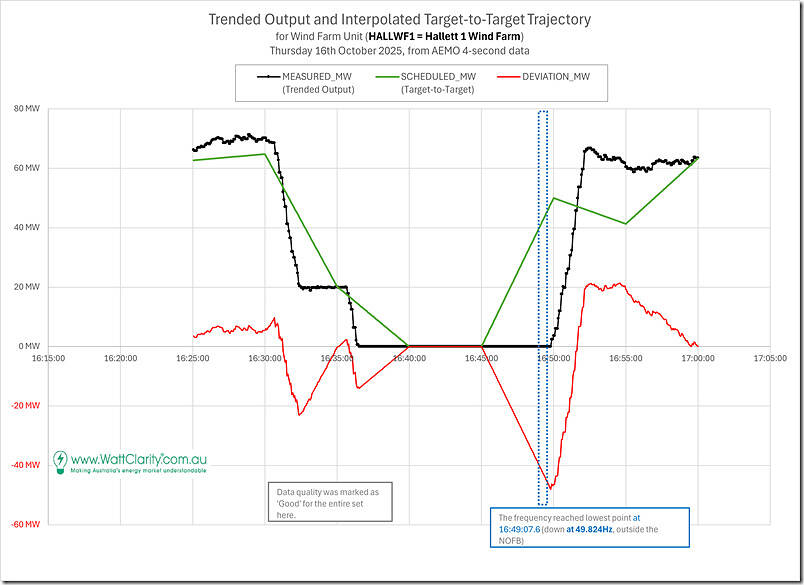
SA Wind Farm (HALLWF1, where Dispatch Error = +48MW … unhelpful)
There were 3 of the 4 x Hallett wind farms that made the list of >40MW Dispatch Error. The first (HALLWF1) was the largest of the 3 at the the 16:50 dispatch interval:
In this case we see both:
1) Fast ramps down ~30 minutes earlier (but not following the Target-to-Target ramp trajectory);
2) And also a delay to start at the 16:50 dispatch interval
(a) Which is longer than for Goyder South 1B
(b) Indeed, it barely gets started until the end of the dispatch interval.
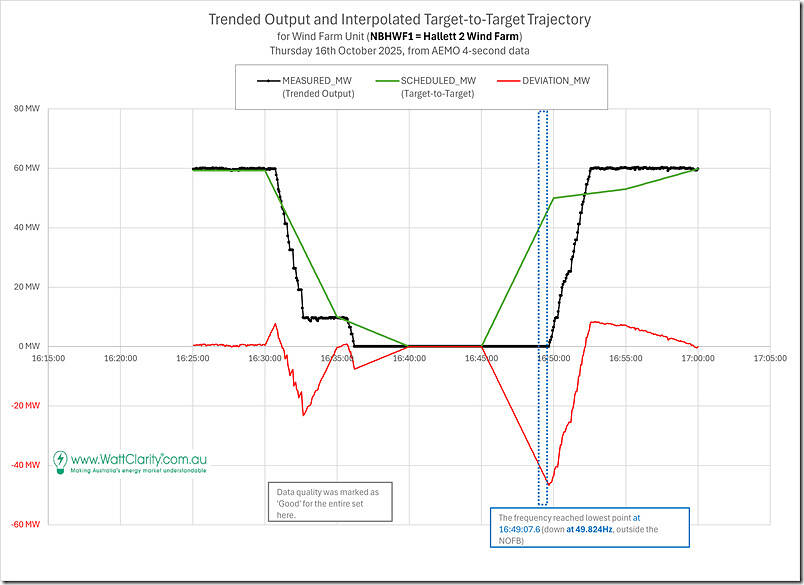
SA Wind Farm (HALLWF2, where Dispatch Error = +45MW … unhelpful)
Here’s a view of the neighbouring HALLWF2 Wind Farm at the the 16:50 dispatch interval:
This unit has some large similarities to the older sibling.
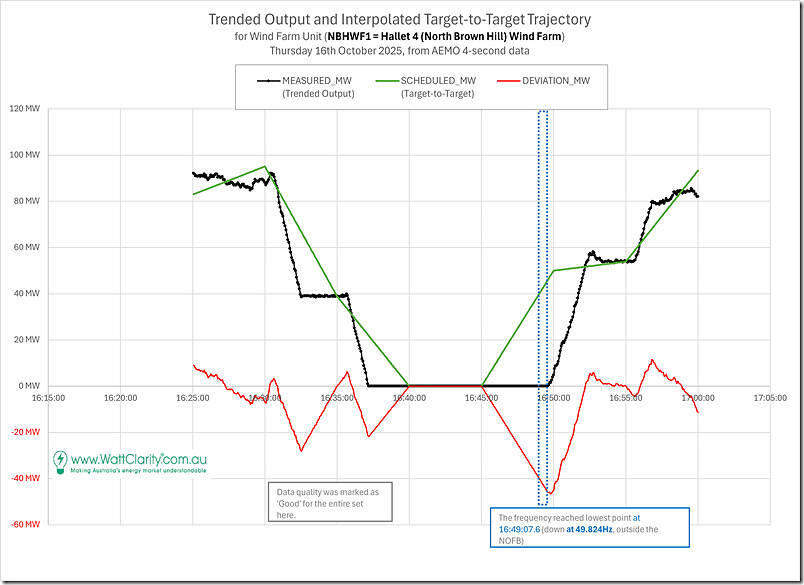
SA Wind Farm (NBHWF1, where Dispatch Error = +46MW … unhelpful)
Here’s a view of the neighbouring Hallett 4 (i.e. North Brown Hill) Wind Farm at the the 16:50 dispatch interval:
This picture is very similar to that for HALLWF1 and HALLWF2.
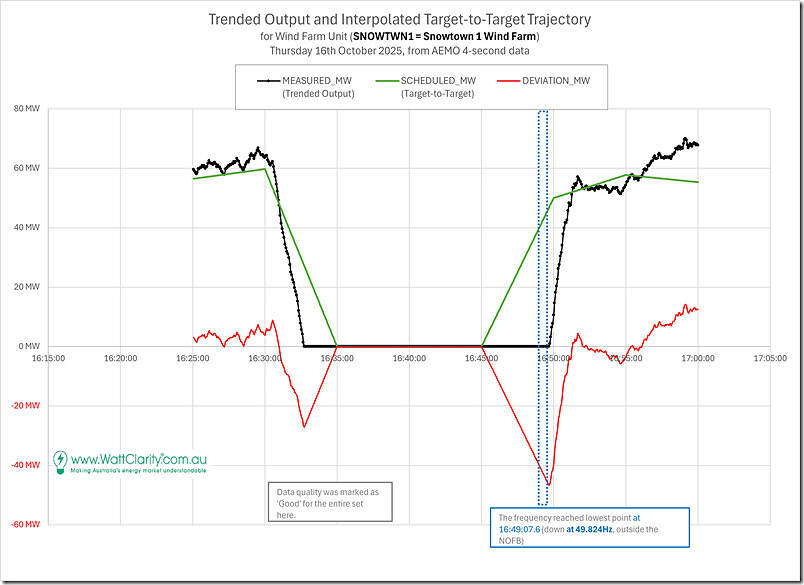
SA Wind Farm (SNOWTWN1, where Dispatch Error = +42MW … unhelpful)
Here’s a view of the Snowtown 1 Wind Farm at the the 16:50 dispatch interval:
This picture suggests some similar underlying physical limitation of plant (like the 4 x WFs above) that cause some delay in ramping up after the SDC has been released.
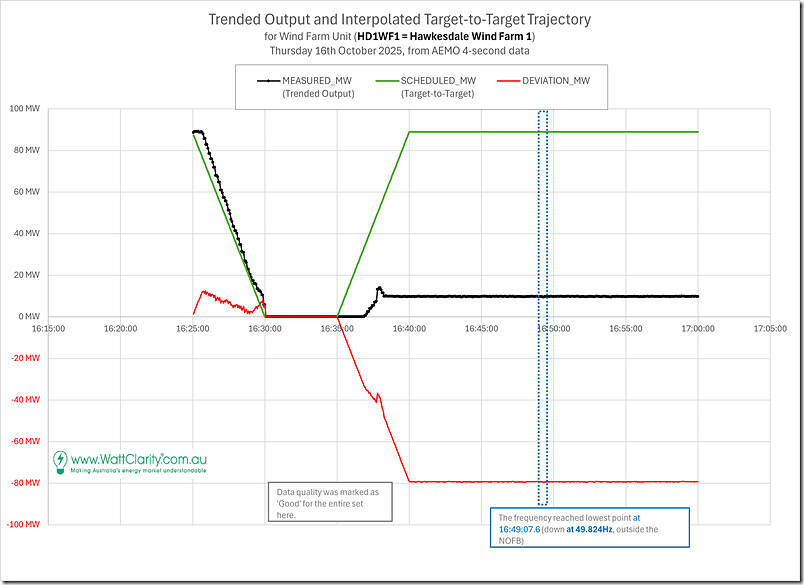
VIC Wind Farm (HD1WF1MW, where Dispatch Error = +79MW … unhelpful)
Here’s a view of the Hawkesdale 1 Wind Farm in Victoria at the the 16:50 dispatch interval:
This is a different picture:
1) i.e. with the unit output limited to ~10MW for reasons unknown … but which does not seem to be reflected in the AWEFS forecast for the unit (which is way up at 89MW instead);
2) including in subsequent dispatch intervals (16:55 and 17:00);
3) but we’ve not had time to explore further.
The remaining 78 x Wind Farm DUIDs
We’re not going to consider the remaining 78 Wind Farms in this article (but they were discussed briefly in Part 3).


Looks like someone is either unfamiliar with the dead time of the wind systems, or they’re using a square wave to join the dots rather than the triangular wave used in the charts above.