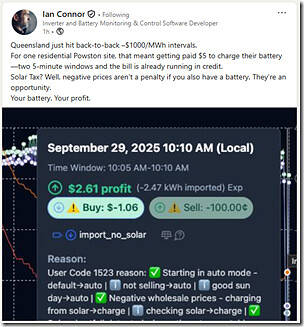
I should be focused elsewhere (such as using what ‘spare’ time I have to prepare my thoughts for next week’s NEMdev conference) but allowed myself to be distracted* when I noticed this update from Ian Connor on LinkedIn:
* note … not entirely a distraction, as will be topical for discussions next week
Ian was writing about the 10:05 and 10:10 dispatch interval (NEM time) on Monday 29th September 2025 … so I would it would be of interest to quickly Time-Travel ez2view back to the 10:10 dispatch interval in order to see what the situation was:
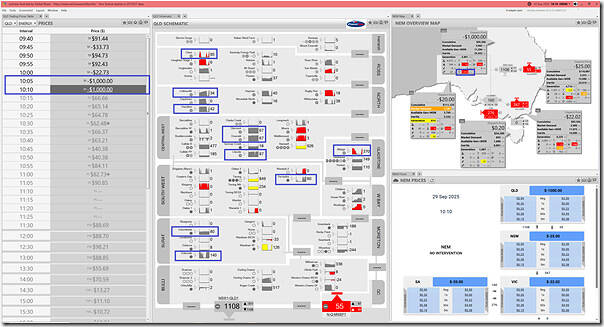
In this first snapshot, we can see:
1) the two spot prices down at –$1,000/MWh,
2) and we can also see that a number of solar farms are still running despite 2 x dispatch intervals down at the Market Price Floor:
(a) In the ‘NEM Map’ widget we see that:
i. the aggregate FinalMW for all Large Solar plant that the AEMO ‘sees’ in real time was at 1,312MW
… noting that this actually dropped from a higher point of 1,567MW five minutes beforehand
ii. remembering that Medium Solar and Small Solar are actually invisible
… though people do increasingly treat AEMO’s estimates as almost the same as the real thing!
(b) In the ‘QLD Schematic’ widget we can see the FinalMW for all visible power stations across QLD:
i. I’ve highlighted some of the biggest contributors to that 1,312MW aggregate solar
ii. There are a several groups of these:
> Some (like Clermont, Emerald, Columboola and others) have been running consistently over the 2-hour history in the spark line;
> Others (like Aldoga, Collinsville, Daydream, Hamilton, Hayman) have just recently increased their output … which is interesting, given the price dropped.
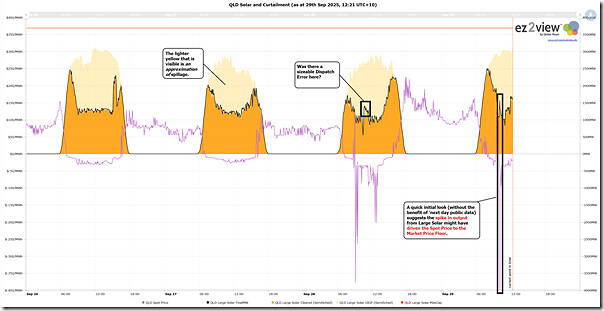
This prompts a use of the ‘Trends Engine’ in ez2view to show this near-term trend of aggregate data (noting we don’t have ‘next day public’ data yet for the current Market Day):
With this chart we can see:
1) Some sizeable curtailment across the main sunlit hours of Friday 26th September 2025, Saturday 27th September 2025, Sunday 28th September 2025 and thus far today (Monday 29th September 2025).
2) What looks to be a sizeable dispatch error on Sunday 28th September 2025 ;
3) And the drop in price to the –$1,000/MWh for 10:05 and 10:10 … that is coincident with (and probably caused by) an increase in output of 487MW to 10:05 (from 1,080MW to 1,567MW at 10:05)
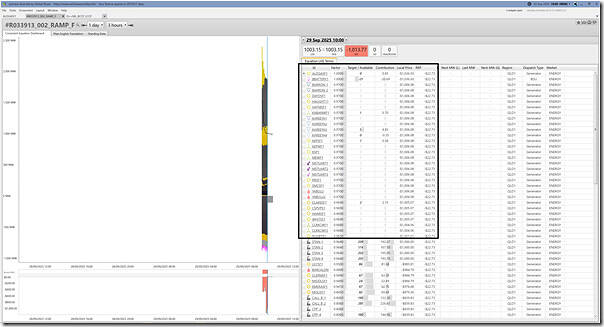
With this final image, we include a ‘Constraint Dashboard’ widget focused on the ‘#R033913_002_RAMP_F’ constraint equation at the 10:00 dispatch interval:
1) i.e. before the price dropped
2) This Constraint Equation:
(a) is a Hard Ramping constraint leading into the ‘Q>>LCCP_CLWU_BCCP’ constraint equation
(b) with respect to the outage on the Larcom Creek to Calliope River (8859) 275kV line
In this image we’ve highlighted a range of units (many solar farms) with large LHS factors that show Local Price below –$1,000/MWh as an indication of being ‘constrained down’ by this hard ramping constraints.
Not shown here, but this constraint equation un-bound for the 10:05 dispatch interval, which enabled these units to increase in output (subject to bids), which thus would have been a significant contributing driving the price to the Market Price Floor.


Be the first to comment on "A quick review of QLD solar (and curtailment) on Monday 29th September 2025 with price at MPF"