
As a provider of market outlooks and price forecasts, we are constantly being asked to provide projections of the future. We are always asked to consider and incorporate different cost assumptions: fuel, capex, and fixed costs. In contrast, only a few investors and market participants are interested in understanding stochastic factors such as the weather. At the same time, our government and market body clients are increasingly asking for analysis that can help them understand the role of the weather, and so the resilience of the grid.
The transformation of the power system to a high penetration renewable world means that these stochastic factors and aspects of our methodology are increasingly relevant to price and dispatch outcomes. The truism that a weather dependent system is heavily influenced by weather conditions is often overlooked by market advisors.
In this article we seek to demonstrate how important weather conditions are for future price outcomes in the NEM. We aim to demonstrate that the use of individual weather reference years gives a limited picture of the future, whereas using a distribution reveals critical information of the future system.
Why does weather matter to price?
There are two main ways that the weather matters to the operation of the system, and so prices:
- First, temperature conditions influence the demand for energy to heat and cool.
- Second, wind speeds and solar irradiance determine the available supply of energy in the grid.
Temperature as a driver of demand
The first of these factors has always been an issue of major importance to the operation of the system. Figure 1 shows the relationship between temperature and Victoria demand for 2025, based on 2 weather reference years (ie, 2002 and 2019). Higher temperatures lead to higher demand for cooling; lower temperatures lead to high demand for heating. The vee-shape can be observed in all regions of the NEM, although the steepness of the arms of the vee depends on the amount of electrification and the degree of energy efficiency in each region.
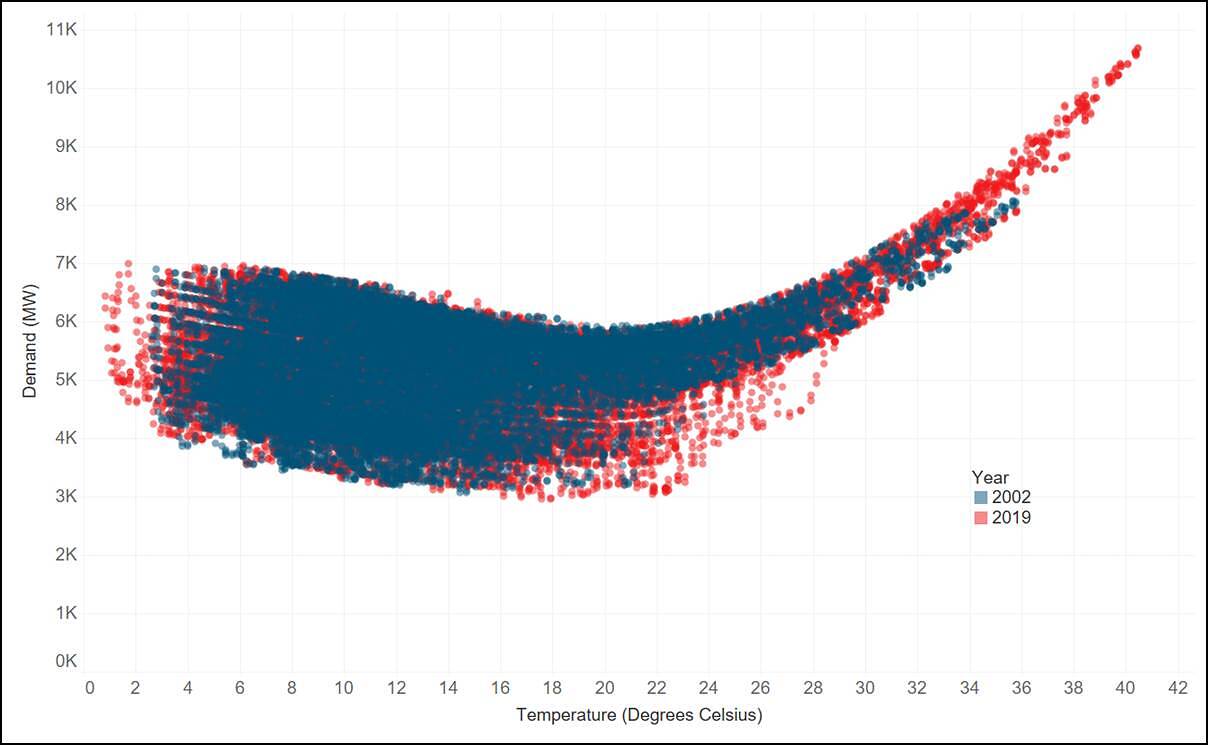
Figure 1 – 2025 Victoria demand versus temperature, 2002 and 2019 weather years
Wind and solar irradiance as the drivers of supply
In contrast, the amount of solar irradiance and wind speeds are growing in their importance to supply in line with higher penetration of renewables. Figure 2 shows the relationship between wind output and price in South Australia over the last 10 years. Each bar shows the average price for each 50 MW bucket of wind output in South Australia. Here we see the rising significance of wind to price, and that when the system is becalmed prices tend to rise as lower merit plant is brought online. Similar results can be shown for solar irradiance, with effects on both the output of rooftop- and large-scale solar.
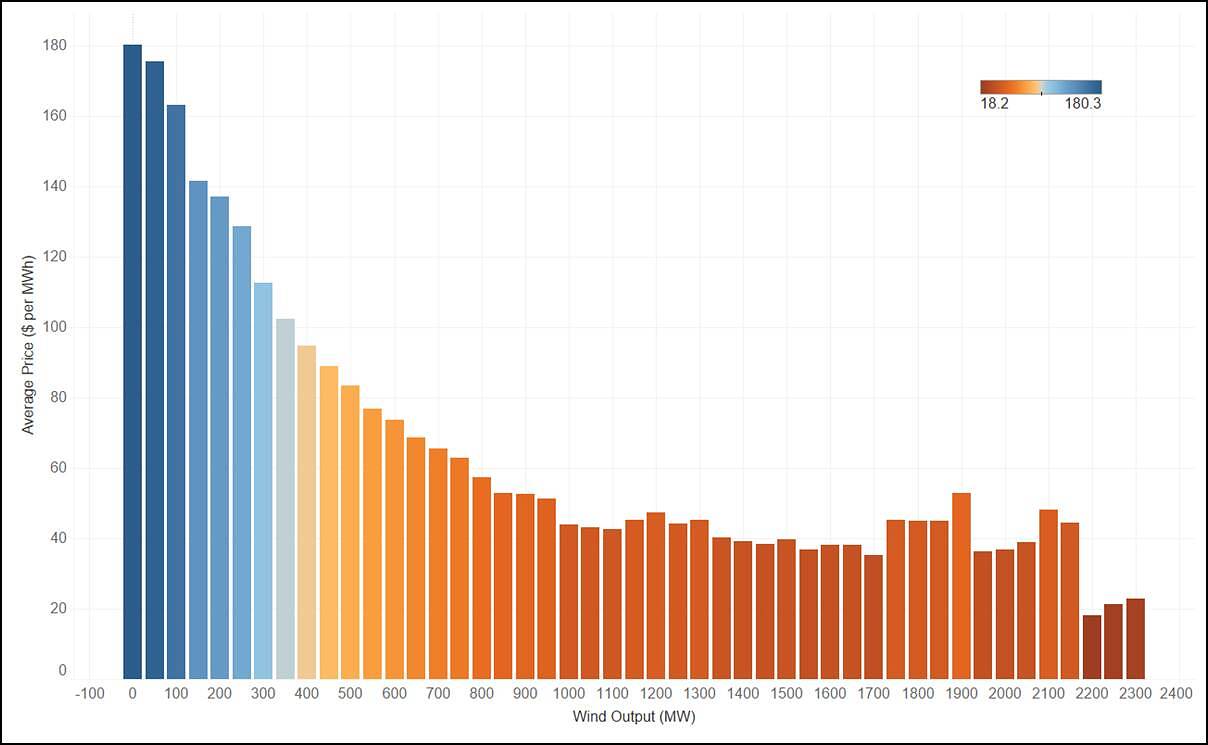
Figure 2 – Wind output versus price in South Australia over the last 10 years
Weather is a major driver of price in the 2030s
One of the powerful aspects of market models is that they can project how different weather conditions affect dispatch, and so price. Endgame offers its clients the ability to examine how different weather years affect market outcomes. Figure 3 shows the NSW annual average price as a percentage of FY2026 price for Endgame’s ‘Sunny Side Up’ Scenario, which sees a generation mix dominated by solar and storage. The figure shows 13 different lines: one for each of 13 weather years.
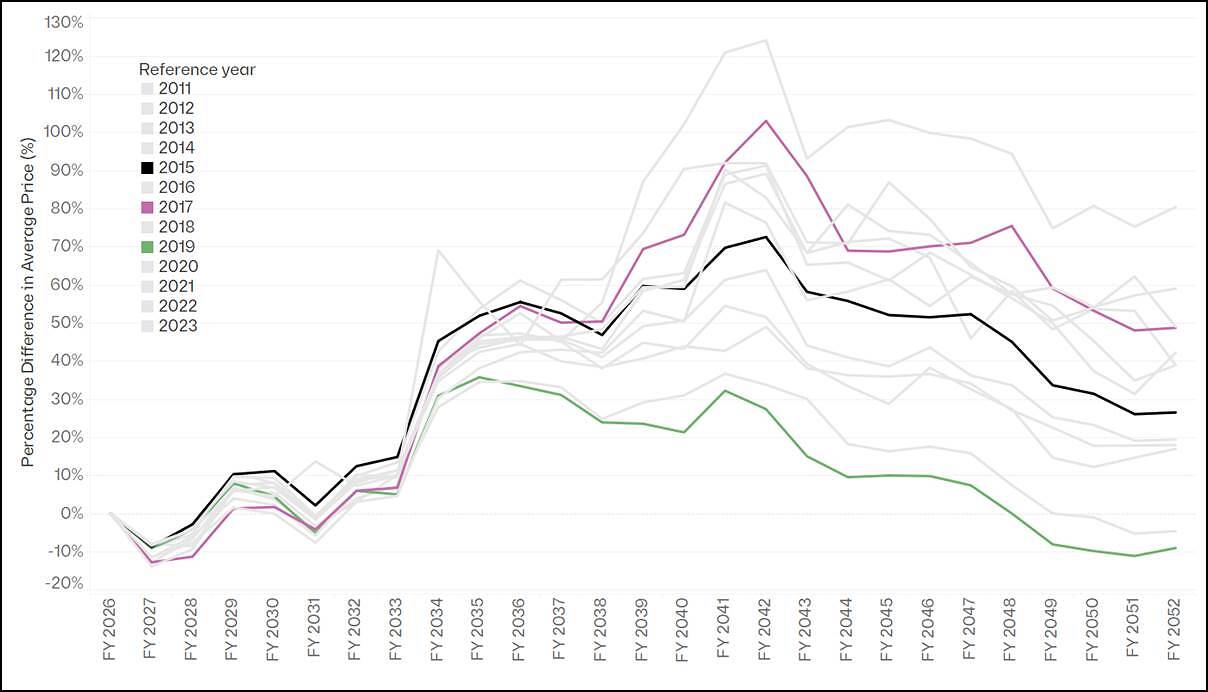
Figure 3 – NSW average annual price as a percentage of FY2026, 13 weather years
The critical feature of this modelling is that we can see that from FY2033 onwards, the system becomes highly weather dependent after the projected closure of a coal-fired power station. We have highlighted three years (ie, 2015, 2017, and 2019) to show just how wide the spread in prices becomes. We note the following:
- The closure of coal kicks the system into a highly weather-dependent world, where outcomes vary greatly depending on how much wind and solar there is in the grid.
- Price outcomes can be almost twice as high in an unfavourable weather year as in a favourable weather year.
- Although not shown here, a large component of the value is derived from prices above $300 per MWh, meaning that volatility is a high driver of average prices in these worlds.
We must start to think about the distribution of prices as a function of weather
The use of individual weather reference years for pricing assessments overlooks a major part of the story of future price outcomes – ie, that the system is becoming increasingly volatile. There are three important implications of this:
- First, this volatility will increase the cost and importance of hedging, ie, the cost and importance of insurance rises in line with risk exposure.
- Second, generators that can manage this risk will be highly valuable, and so this volatility has massive implications for the business cases for storage and gas-fired generation.
- Finally, changing weather means changing supply. As the climate changes, we must increase our margins of error to account for changing weather patterns. Very little analysis has been completed on this front – we need to assemble more information about how climate change will alter weather patterns, and so the nature of grid supply.
Analysis of multiple weather years is inherently more complicated. But without the additional insights that come from looking at the shape of the distribution, we are only seeing one dimension of the future picture. The system we are building is stochastic, and so our modelling needs to be as well.
This article was originally posted on the Endgame Analytics blog, and has been republished here with permission.
About our Guest Author
 |
Oliver Nunn is the Managing Director of Endgame Analytics.
Oliver has extensive experience building mathematical models that represent economic dispatch and long-term investment in electricity markets. He has built models that capture complex aspects of power system and market operation, such as decisions to start and stop plant, game-theoretic bidding, and decision making in the presence of uncertainty about the future. In addition, Oliver has experience as a regulatory economist and expert in market design. He has extensive experience working as an advisor to the market bodies that oversee the energy sector, the participants that operate in the markets, and the network businesses that own the transmission and distribution assets that are part of the physical power system. You can find Oliver on LinkedIn here. |
There were 4.8 million people in Victoria in 2002 and 6.5 million in 2019. Have you normalised the demand for population?
Its interesting to note that Victoria’s aggregate electricity demand decreased from 52,976 GWh/year in 2002 to 46,885 GWh/year in 2019 in spite of a population growth from 4.8 to 6.5 million.In that period solar/wind generation increased from zero to 17% of total generation.At the same time average annual wholesale electricity prices increased from $35.44/MwH to $124.88/MwH which appears consistent with the increased volatility as shown in the graph above.