Winter 2025 has arrived, with a cold front driving windy weather, lower temperatures, and snow falls in the expected areas this weekend. For a period of time over this weekend the NEM-wide wind production has peaked above 8,000MW as clients can see in this live Dashboard view, and we an also see that:
1) This is a fair way below the ‘new all-time record for NEMwide production from Wind on Monday 26th May 2025’ …
2) and is also just below the prior all-time record (8,431MW on Thursday 30th May 2024).
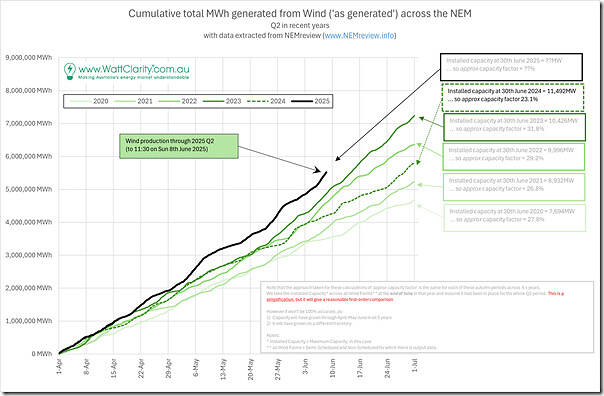
Today I utilised NEMreview v7 to extract some wind production data from 1st April 2025 (i.e. for 2025 Q2 ytd) and updated the ‘worm line’ chart that was used a couple times through the wind drought of 2024 Q2, including in these final figures. This is shown below:
Clearly the cumulative quarterly production is trending above the other Q2 periods shown. We’ll check back after the end of the month (as time permits) to update this analysis.


Be the first to comment on "Cumulative ‘worm line’ view of NEMwide wind production in 2025 Q2 (to Sunday 8th June 2025)"