As they were occurring, we noted some instances of price volatility over several consecutive days earlier this month:
- On Monday 7th April 2025;
- On Tuesday 8th April 2025;
- On Wednesday 9th April 2025;
- On Thursday 10th April 2025;
- though not so much on Friday 11th April 2025.
In the following week and using the ‘Bids & Offers’ widget in ez2view, I’d dropped out a few images a few days ago, but had put them to one side whilst working on other things.
However for a couple reasons I wanted to post this today, as food for a few articles that might follow …
Aggregated supply stack for QLD and NSW … all units
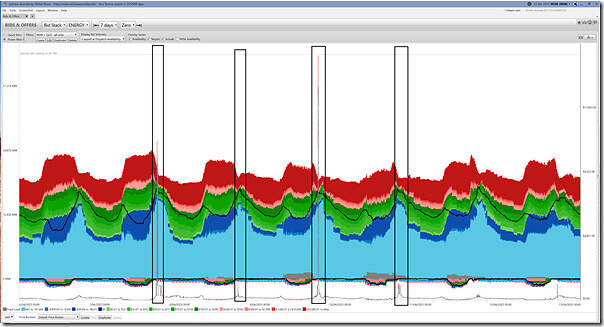
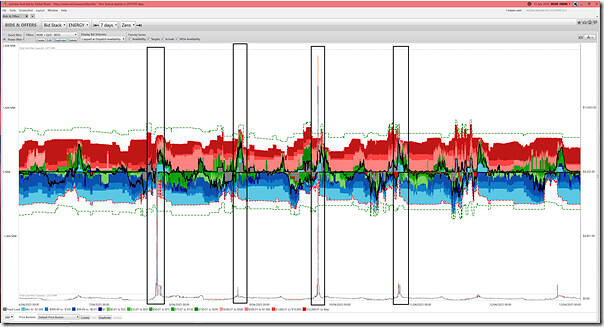
Let’s start with this aggregated supply stack for all units across QLD and NSW … remembering that:
- (post IESS) the consumption side of all batteries (which are now BDUs) show consumption as negative quantities …
- so, to be consistent (even though it’s not done this way in the EMMS) in ez2view we have also reversed the sign of consumption in Scheduled Loads (i.e. Snowy, Shoalhaven and Wivenhoe, in this case).
This is a 7-day lookback from 00:00 beginning Sunday 13th April 2025, with price trace for QLD and NSW shown superimposed to help readers spot the periods of volatility.
There’s clearly a few different stories here, including:
1) A large amount of capacity unavailable, in aggregate, through the week-long period.
2) Of the volume available, a large proportion bid down at –$1,000/MWh at the relevant RRN during the volatile periods.
Drilling into each ‘Fuel’ Type of unit … across QLD and NSW
Let’s now take a step further and separate this out (using images I dropped out about a week ago using a slightly earlier version of the ez2view software), looking at various different types of units.
Firming capacity, across QLD and NSW
For a start we’ll look at Firming Capacity, starting with the older technologies …
Coal units in QLD and NSW
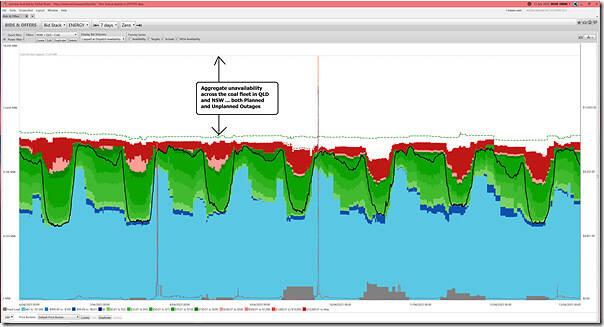
I’ve already written about another unplanned outage at Callide C3, and also about a few Bayswater units being temporarily unavailable through this period. That’s on top of a couple planned outages you can see in this summary view at 9th April.
The sum total resulted in this supply stack:
Two main take-aways here were that:
1) There’s a sizeable amount unavailable through the week;
2) But, for the plant that was available, it (bid low and) ran very heavily during the periods of volatility.
Gas and Liquid units in QLD and NSW
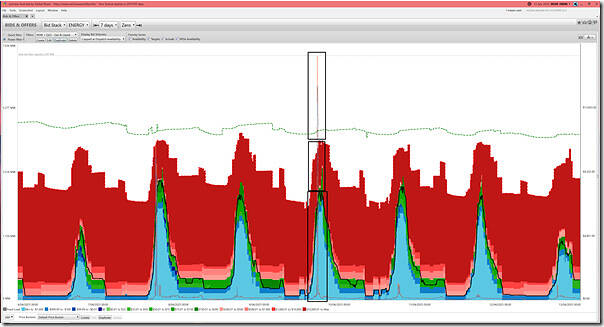
Staying with the fossil fuelled tech for now, here’s an aggregate of gas and liquid fuelled generators in QLD and NSW:
There’s essentially three different segments here:
1) A sizeable volume of capacity unavailable (even in PASA Avail);
2) Of the capacity available, some bidding up towards the Market Price Cap, so not getting a run through these volatile periods
3) Of the capacity available, however, a sizeable amount bidding down to the Market Price Floor to ensure it ran during these volatile periods.
Hydro units in QLD and NSW
Staying with the fossil fuelled tech for now, here’s an aggregate of gas and liquid fuelled generators in QLD and NSW:
Some questions here, as well…
BESS (now BDU) units in QLD and NSW
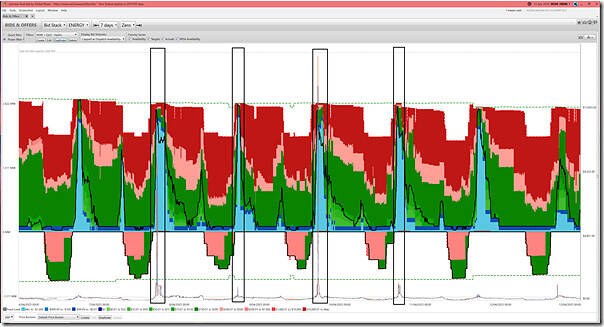
Since the IESS change, all batteries (i.e. or at least the ones large enough to require registration with the AEMO) are now operating as BDUs … so this supply (and demand) stack is (almost) symmetrical around 0MW:
Some questions here, that could be explored in future:
1) Such as with respect to the relatively low available capacity compared to aggregate Maximum Capacity
… is this just due to commissioning of some new batteries, or are there also other reasons?
2) Some interesting nuances in bid prices of that capacity which was available on each of these evening periods.
Nary a Negawatt, for QLD and NSW
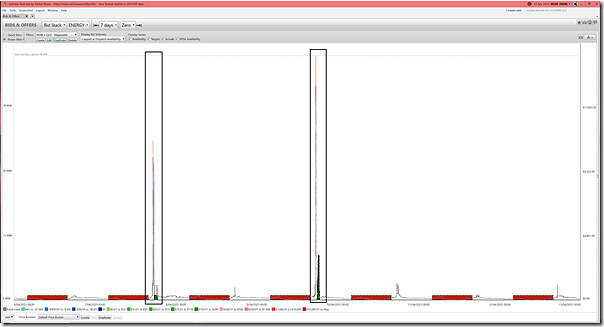
To round out the ‘new tech’ fleet, here’s a chart of the aggregate contribution from negawatts in QLD and NSW:
More head-scratchers there, in terms of:
1) The very low aggregate registered capacity of negawatts in QLD and NSW … 3.5 years after the commencement of the WDRM;
2) Even below the low level of registration, the level of availability was very, very poor
3) And, head-scratching even more, what little was available was not even timed for the periods of tight supply-demand balance (and hence volatility).
Some questions for the current AEMC review process…
VRE, across QLD and NSW
With respect to the ‘Anytime/Anywhere Energy’ component of the technology mix, let’s look at each in turn…
Solar units in QLD and NSW
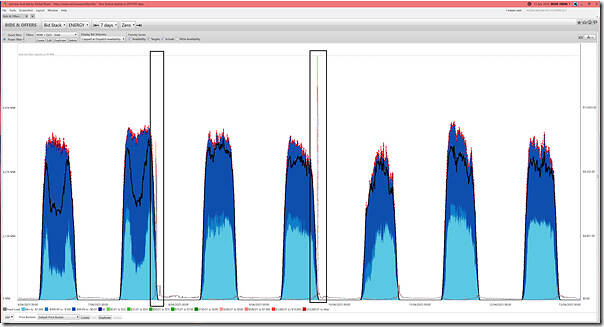
Here’s the supply stack of Large Solar units across QLD and NSW, showing bids truncated to the Availability taken account of within NEMDE (remembering Linton’s explanation here of how this comes about).
No surprise that the autumn evening spikes in volatility coincided with the sunset periods, and the timing mismatch between the (earlier) decline of solar and the (sometime later) subsidence in Underlying Demand.
Wind units in QLD and NSW
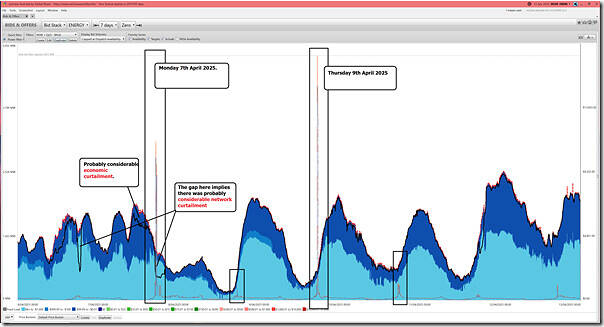
Similarly, here’s the wind supply stack:
With this image, we see:
1) Coinciding with (and contributing to) the evening price spikes was a cyclic lull in aggregate Wind Generation availability through these periods.
2) This appears to have been particularly exacerbated by strong network curtailment in the evening of Tuesday 8th April 2025
We’ll leave this here for now…


Leave a comment