
This article reviews regulation FCAS costs in 2024, relative to maximum capacity.
We use GSD2024 to summarise 2024’s regulation FCAS costs allocated to units.
Typically, past comparisons have focused on the renewables sector given relatively high allocation of regulation FCAS costs to units/portfolios of this type.
However market arrangements for recovery of FCAS costs (and regulation of frequency in general) are changing. The changes will impact all units.
Consequently, this article captures all appropriately metered units in a single chart. It provides a basis for contextualising costs under the new arrangements effective 8 June 2025.
Costs per MW of capacity
Here’s the chart for appropriately-metered units (effectively scheduled, semi-scheduled and significant non-scheduled units).
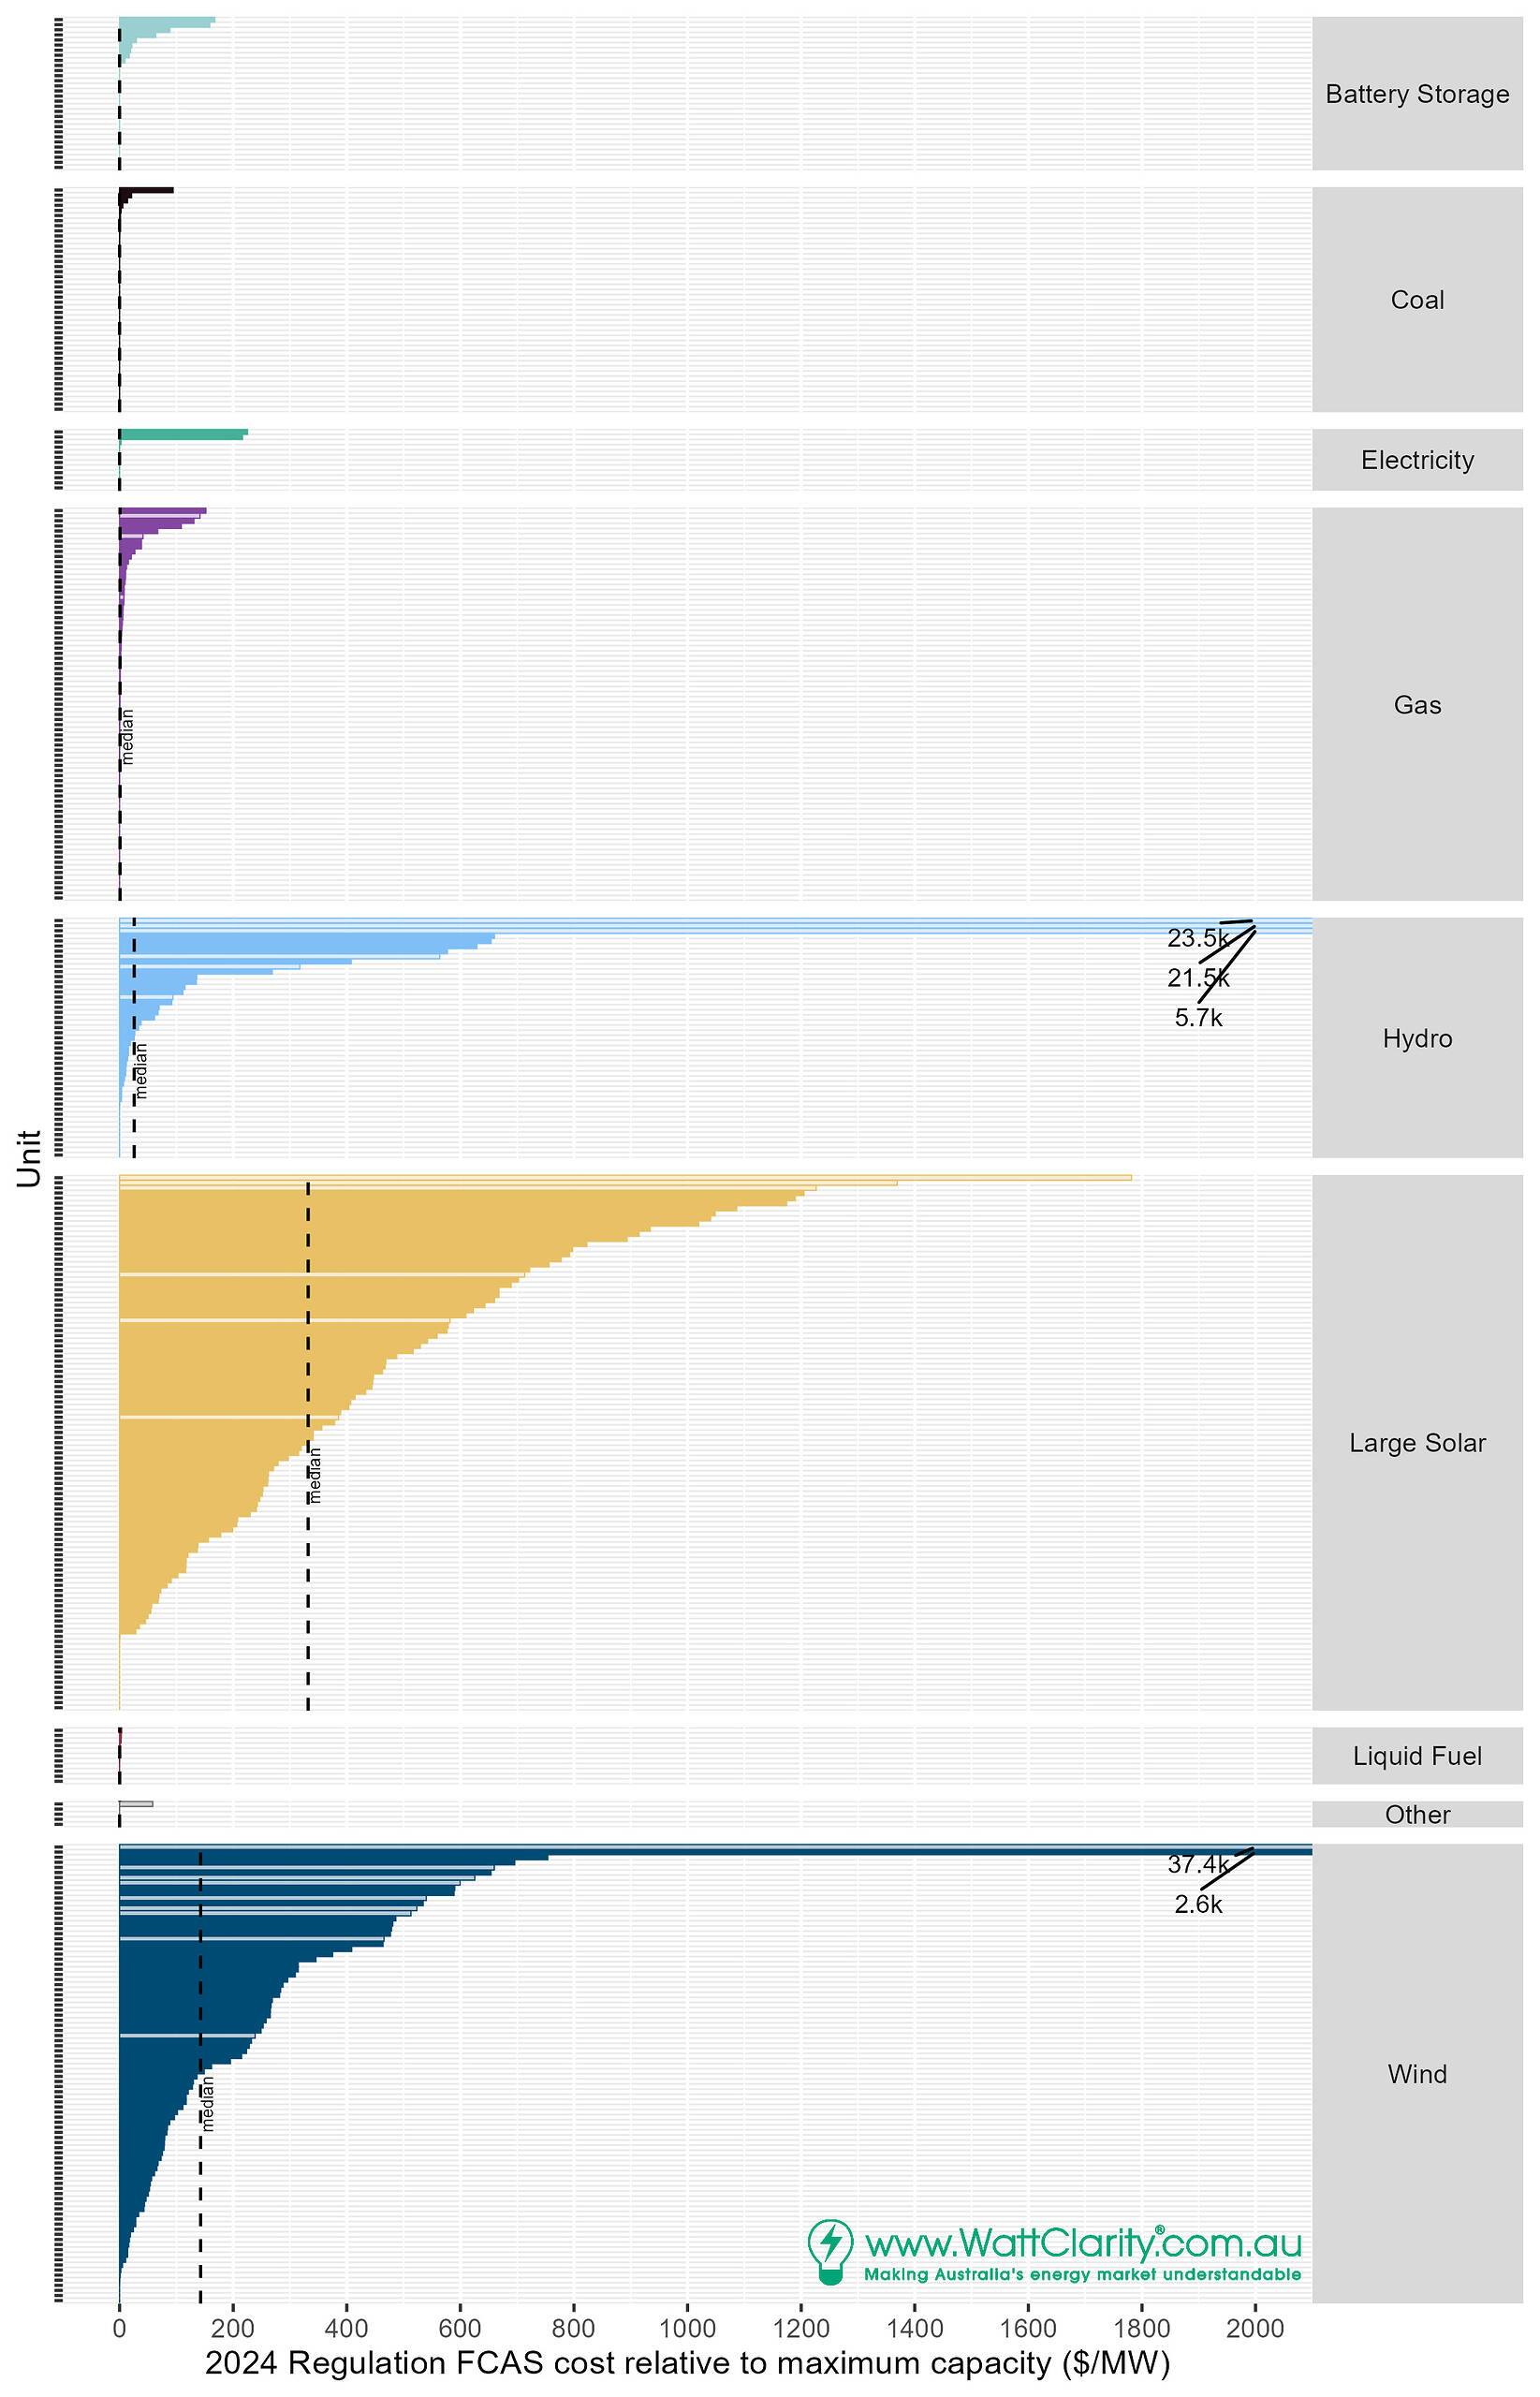
We reduced the size to provide easier viewing of the whole. A high-resolution image is accessed by clicking (ctrl-click to open in a new tab).
Note that non-scheduled units are rendered with a lighter fill to distinguish them from units that get dispatch targets.
The median value for each fuel type category is marked by the vertical dashed line.
Observations
Low cost categories
Battery storage systems, coal and gas units attracted relatively low costs in 2024, relative to wind and solar.
Pumps
Electricity units that registered elevated costs per MW included pumps for pumped hydro stations.
Some large cost values for hydro
Somewhat unexpectedly, some hydro generation units saw large costs, relative to size.
These were non-scheduled units, as indicated by lighter colour.
The scheduled hydro units generally saw lower relative costs.
Variable renewable Energy (VRE) units
Median values for VRE units (large solar 330 $/MW, and wind 140 $/MW) are well above the next highest category, hydro at 26 $/MW. In terms of fleet number, these are also the largest two groups of units.
Non-scheduled units also found themselves at the top of the wind and large solar rankings.
Smaller categories
Units running on liquid fuel or ‘other’ types (think bagasse) attracted low costs relative to capacity, but these may have also operated sparingly meaning the costs could offset a higher proportion of energy market revenue.
The challenge with being non-scheduled, and having a variable renewable resource
We’ve seen how many non-scheduled units end up at the high end of the rankings, in the chart above. Especially in the solar, wind and hydro categories.
Non-scheduled units don’t receive targets, yet their output is assessed for frequency contributions relative to an expectation of unit output. The unit’s output is expected to remain constant throughout the dispatch interval, at its interval-beginning value.
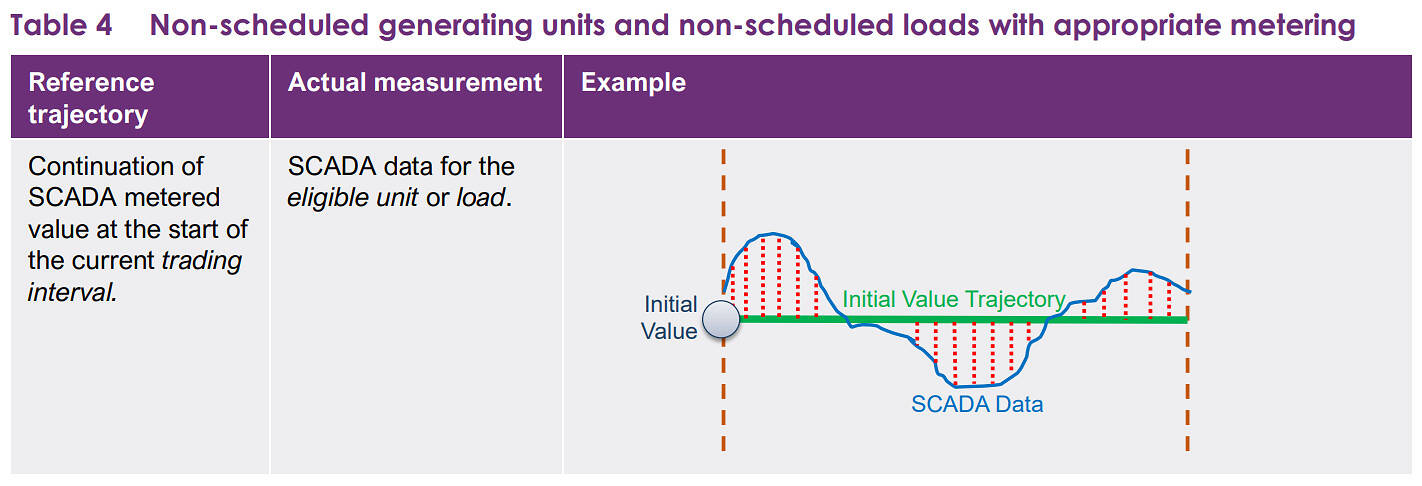
Source: AEMO’s Frequency Contribution Factors Procedure.
Due to this, deviations from the expectation can stack up quickly when the unit ramps up or down.
In the case of non-scheduled VRE units this happens frequently, from one interval to the next. The large deviations can fall on the wrong side of the frequency indicator and drive the unit’s share of FCAS costs sky-high.
Upcoming changes
Upcoming changes on June 8 2025 will disrupt patterns of performance and cost allocation. The changes will introduce the Frequency Performance Payments system.
We will be following the outcomes closely.
Leave a comment