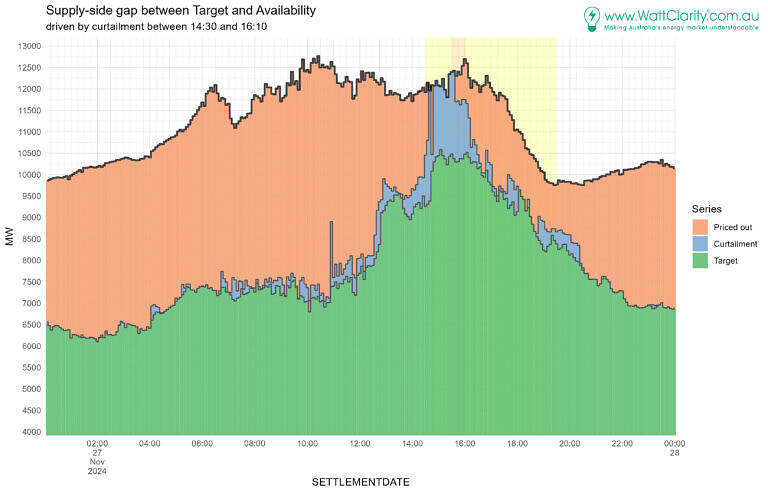
Taking another look at the 27th of November we aggregate the supply availability measures reported in Availability utilisation on 27 November 2024 in NSW into region totals.
The region aggregates show how supply was curtailed rather than priced out between 14:30 and 16:10 (approximately). The curtailment component represents the majority of the gap during that time. We calculate curtailment was upwards of 2,000 MW during the extreme periods.
The regional total for NSW supply dispatched, curtailed and priced out was as follows:
Curtailed availability not able to alleviate reserve levels
Stating the obvious with that header, but permit me to elaborate.
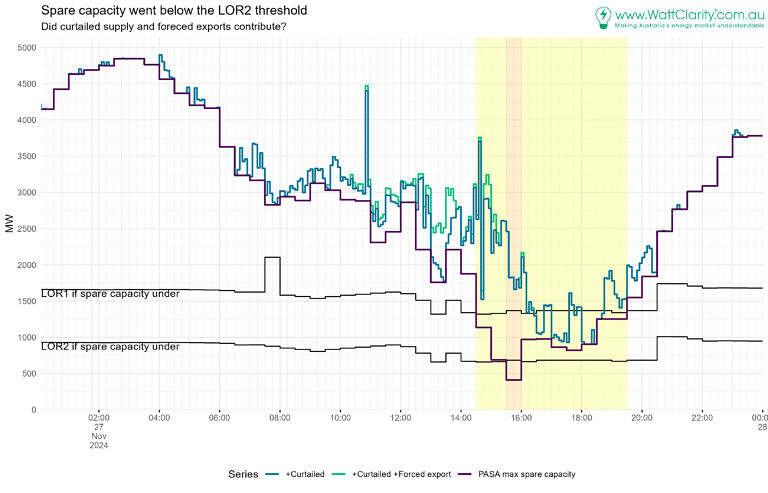
When max spare capacity of a PASA result drops below a threshold a LOR1 or LOR2 condition may be declared. If there are constraints impacting supply there will be a lower projection of spare capacity, increasing the chance of LOR conditions.
In the chart below we highlight the low spare capacity levels of the November 27 in light yellow and orange.
In the chart below we see:
PASA max spare capacity, which dropped below the LOR2 level in the 15:30 to 16:00 half-hour.
We also construct two additional series’ to arrive at alternative views of capacity:
Series [Max spare capacity + curtailed availability]
Adding curtailed supply to max spare capacity aids evaluation of the extent to which availability that was curtailed might have raised reserve levels, if not needing to be curtailed.
Series [Max spare capacity + curtailed availability + forced interconnector exports]
Including forced exports accounts for an additional impact of network congestion that can force interconnector flows out of NSW. During the high NSW price period flows to VIC or QLD were often forced to flow in a counter-price direction.
When we focus on the period when the availability gap was predominately driven by curtailment (14:30 to 16:10), and we inspecting the +curtailed series:
- The chart demonstrates how curtailed supply (if able to be dispatched) could have kept NSW out of LOR1 and LOR2 territory in the leadup to 16:00. Preventing interconnector exports could have helped too.
After 16:00 the level of spare capacity + curtailed fluctuated about the LOR1 threshold.
What might this mean for reserves in 2027?
I’ve taken a back-of-the envelope approach to making an estimate on what the events of the 27th might tell us about meeting demand in 2027, once Eraring closes.
Some data points we will use are:
- During the period of extreme prices Eraring’s availability was 1,950 MW (unit 3 was offline, so not contributing, other units were available but under max capacity).
- Bayswater’s unit 2 and 3 were out reducing supply availability from that power station by 1,370 MW (685 MW each, based on unit 4’s availability being ~685 MW on the day).
So let’s now consider we are at September 2027, instead of 2024. Eraring has closed.
- If we use conditions of the day, availability would be down -1,950 MW; a reduction for Eraring’s availability.
- But we might (optimistically?) expect Bayswater’s 4 units to be running; we add 1,370 MW.
- Note this could also come from any of the dispatchable generators that were unavailable on the day. But is seems conservative to not expect 100% availability from all units in September.
- That leaves us in a net position of -580 MW, lower in supply availability, all else being equal.
To replace this with VRE, for the conditions on the day, we might assume the day’s availability factors the percentage of max capacity that was available for dispatch. Availability factors on the day for wind did vary but we had to pick a number.
- In the interest of simplicity we take 48% for wind and 43% for solar (performance in interval 15:10).
So we may now say that we would require somewhere between 1,200 and 1,400 MW of VRE (depending on the mix) to provide the equivalent supply availability of that removed by closures in 2027 (net of Bayswater providing more).
After recently glancing at AEMO Generation information (October 2024 release) it does appear we are on kinda on track to see this, in NSW.
- For solar, NSW looks to be adding 1,960 MW (committed and anticipated) by the end of 2027.
- For wind, NSW looks to be adding 470 MW (committed and anticipated) by Feb 2028.
- Actually, that’s not that much, and most of it is Uunugula wind farm (414 MW by Feb 2028).
- So, there’s potential to exceed that 1,200 – 1,400 MW replacement level we approximated above (while the sun is shining).
In the clear, right? Well, what about curtailment?
Let’s reflect on network congestion on the day.
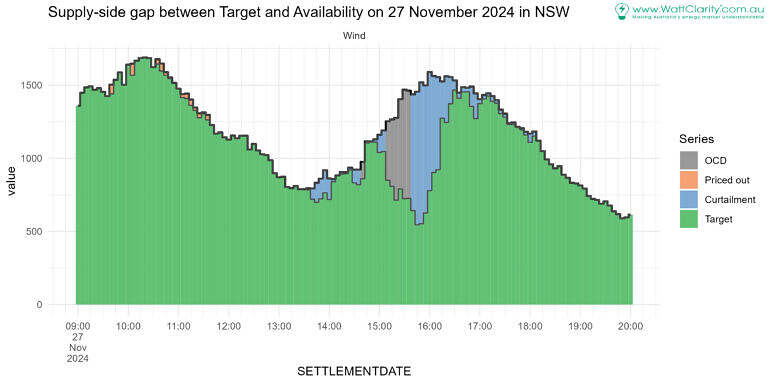
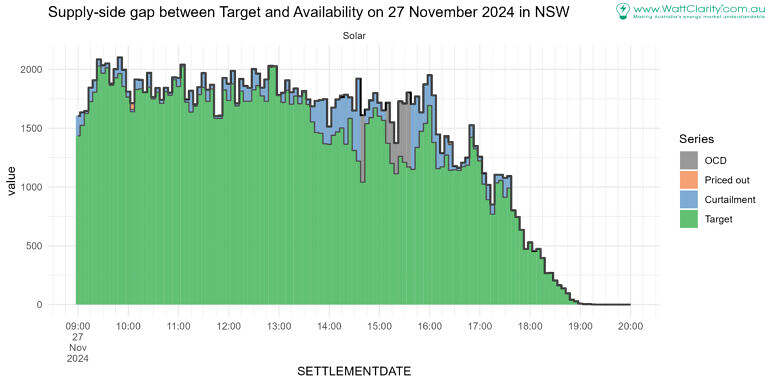
Solar and wind availability was already curtailed considerably.
- How much more can we add and realistically expect it to be able to be dispatched?
To recap, here are the two curtailment-by-fuel-type charts for solar and wind:
So, to try to conclude.
On the 27th November 2024:
- It appears there was enough supply to keep the region out of LOR1 conditions on the 27th during the spiciest part of the day.
- Yet spare capacity did dip into the LOR2 zone.
- Contributing was the curtailed availability, at times in at the level of 1,000 – 2,000 MW.
- So the problem appeared a transmission congestion problem rather than specifically a supply problem.
Looking to the future:
- There may be enough VRE in the pipeline to help cover Eraring’s closure in MW terms, for a day like the one we analysed and also with our assumptions.
- (a net reduction of 580 MW, adding committed and anticipated new VRE builds, and if we also include 1,370 MW of coal unit availability not being offline).
- Demand was not that high though!
- However, curtailment was restricting NSW generation on the 27th. Particularly wind and solar.
- With this in mind, it is foreseeable that adding more generation in the already-constrained parts of the network will materially suffer from congestion, impacting ability to meet demand in 2027.
We already knew that it’s not only “what you build” but “where you build it”. The circumstances of the November 27, 2024, provided another demonstration of this.


Great insights Linton!
Always important to look ahead.
This might be improved by including EnergyConnect and observing if NSW would have been helped or hindered by SA demand / generation profile at that time with Eraring gone?
EnergyConnect won’t assist with the transmission bottlenecks between southern NSW (Wagga / Yass / Canberra) and greater Sydney. Humelink will ease those limitations but construction of that project hasn’t commenced yet.
Great article Linton,
I suspect batteries might prove the key to keeping the lights on in 2027. About 3GW/10GWh committed or anticipated for NSW, primarly 500MW/2GWh Liddell, 850GW/1.7GWh Waratah, 415MW/1.7GWh Orana & 275MW/2.2GWh Richmond Valley.
Great graphs Linton. I wonder if you could shade on a NSW map the areas containing the constrained generators at the time of peak congestion?