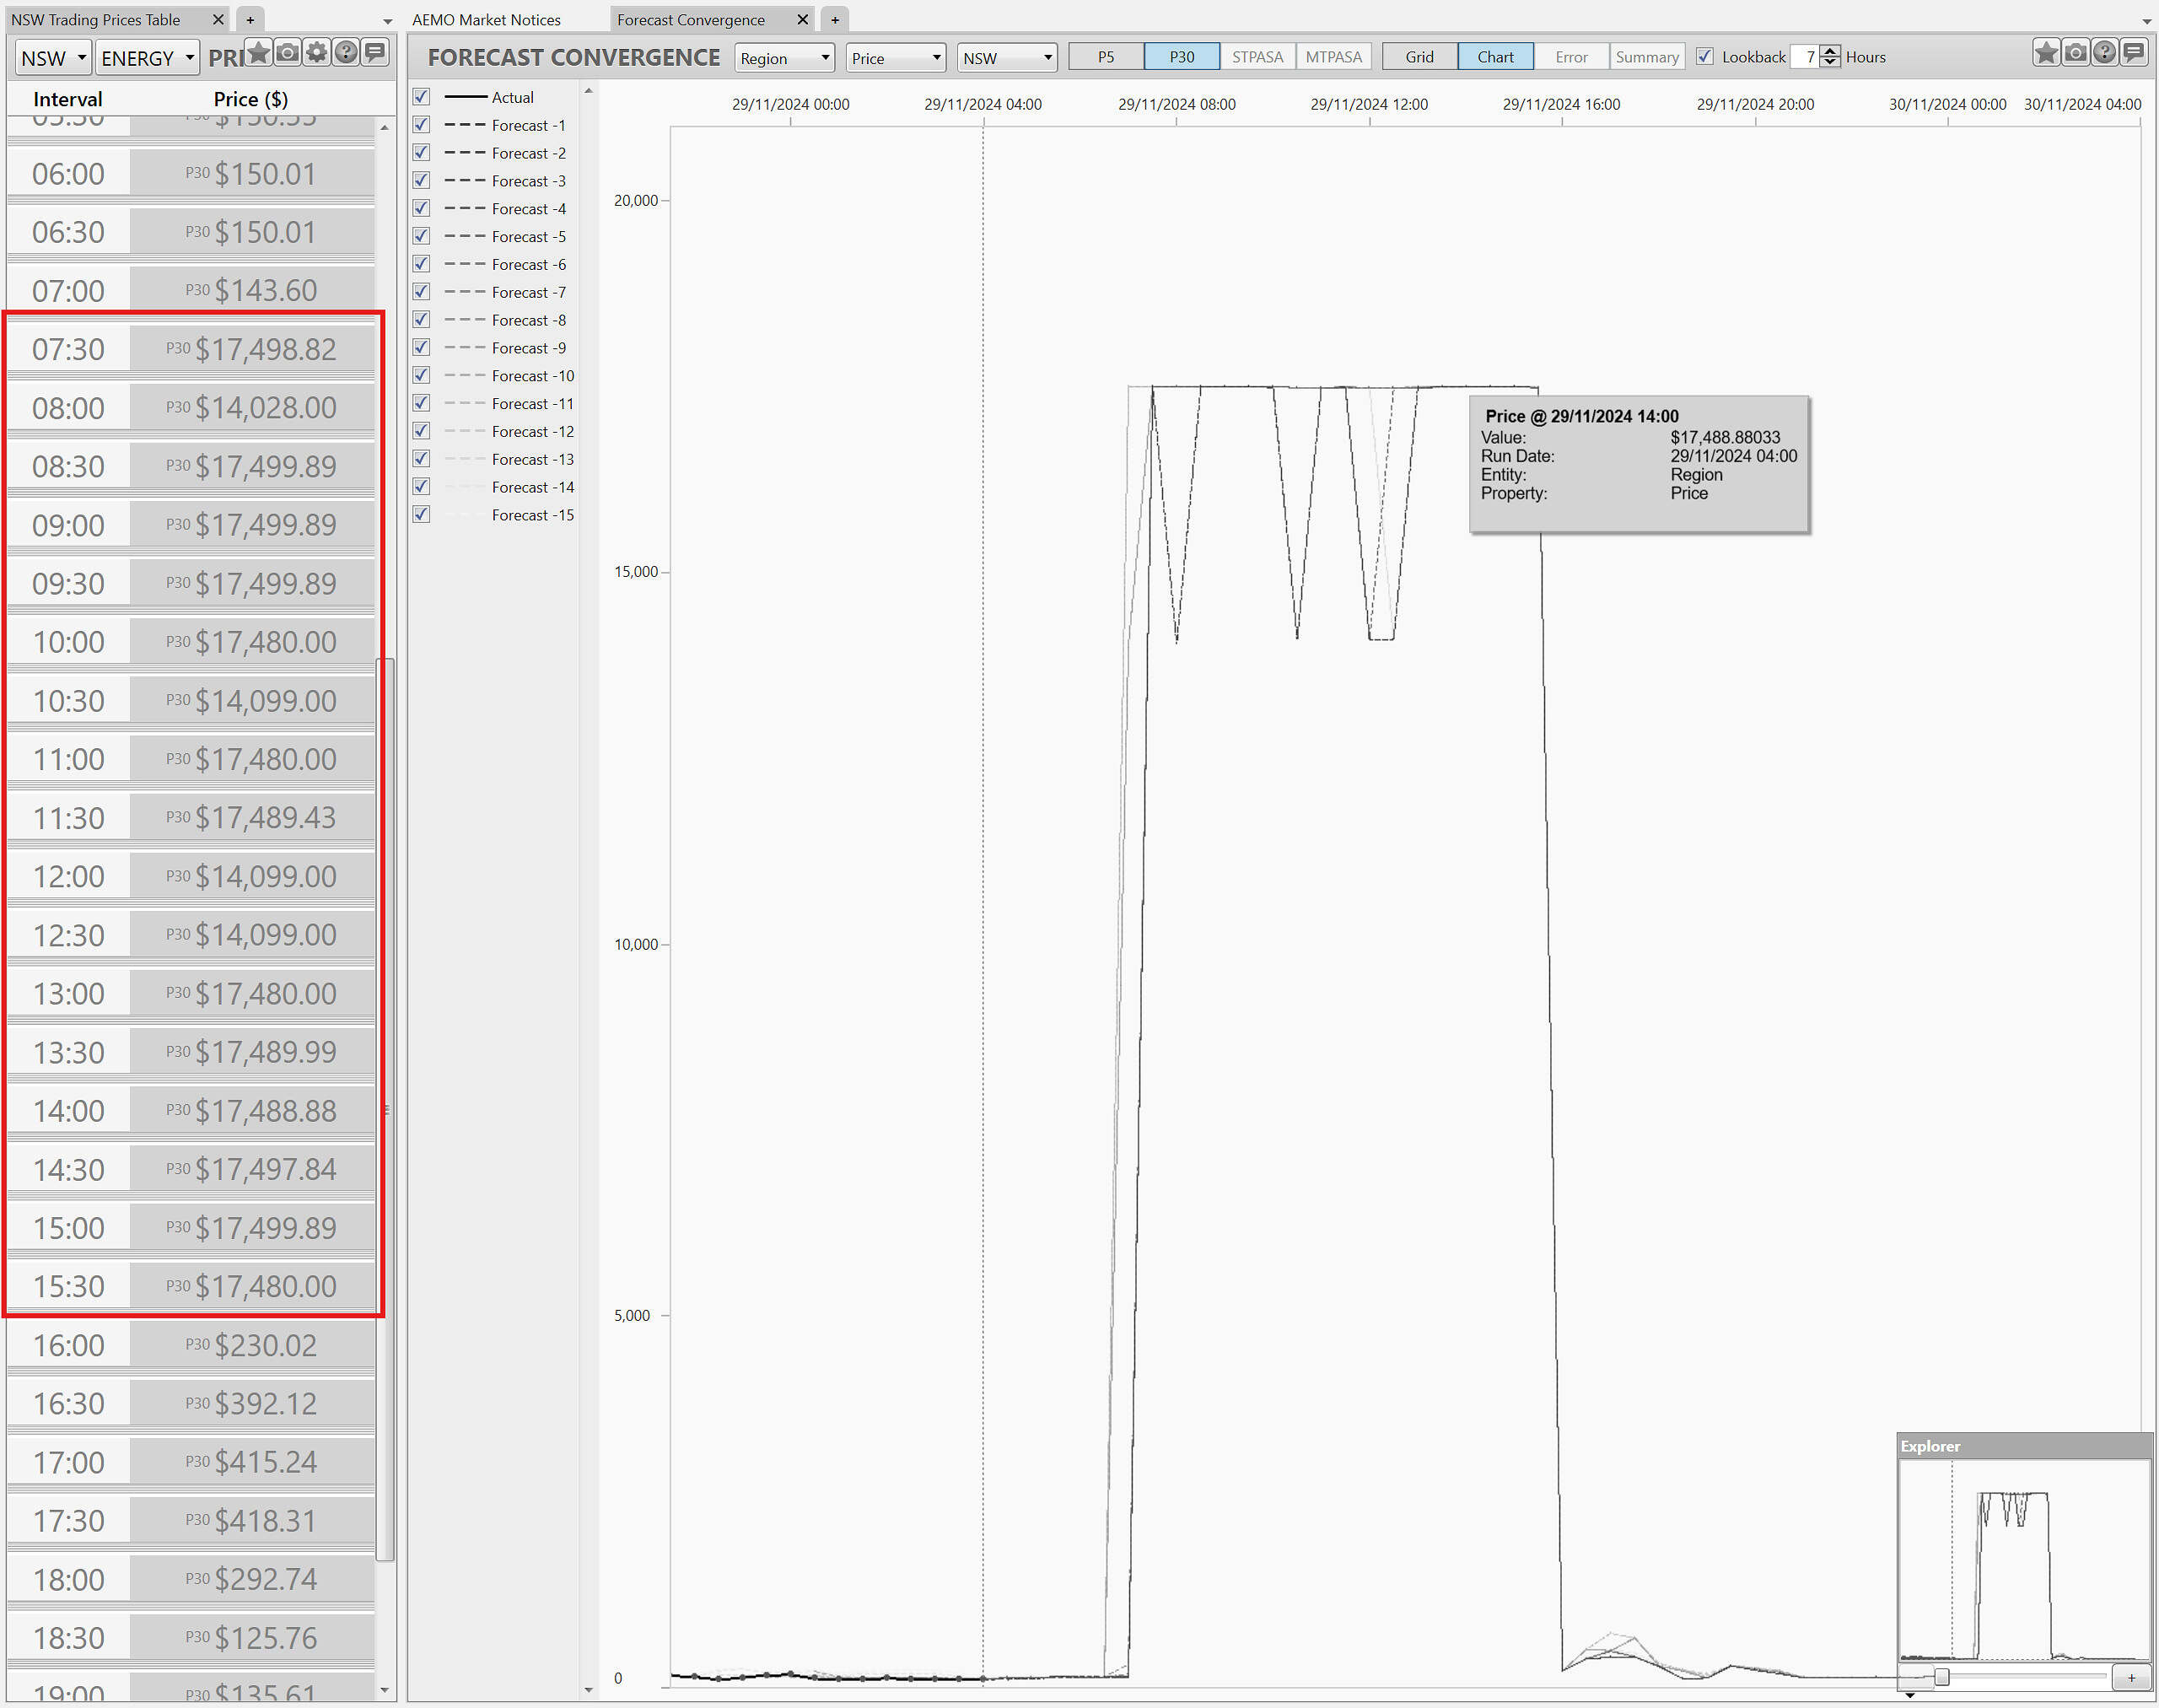
A curious phenomenon we’ve been watching with interest today, the 29th of November 2024, has been the somewhat persistent and alarmingly high predispatch price forecasts for NSW.
If you had looked at the predispatch forecasts last night, you might have been shocked to see NSW Energy prices forecast to spend more or less the whole day at or near the MPC of $17,500.
But, as the day progresses, apart from a short burst of actual volatility at 06:55 and 07:05, these predispatch forecasts have not ended up materialising in P5min forecasts or dispatch, disappearing seemingly “just in time”. Actual prices have been very moderate throughout the day.
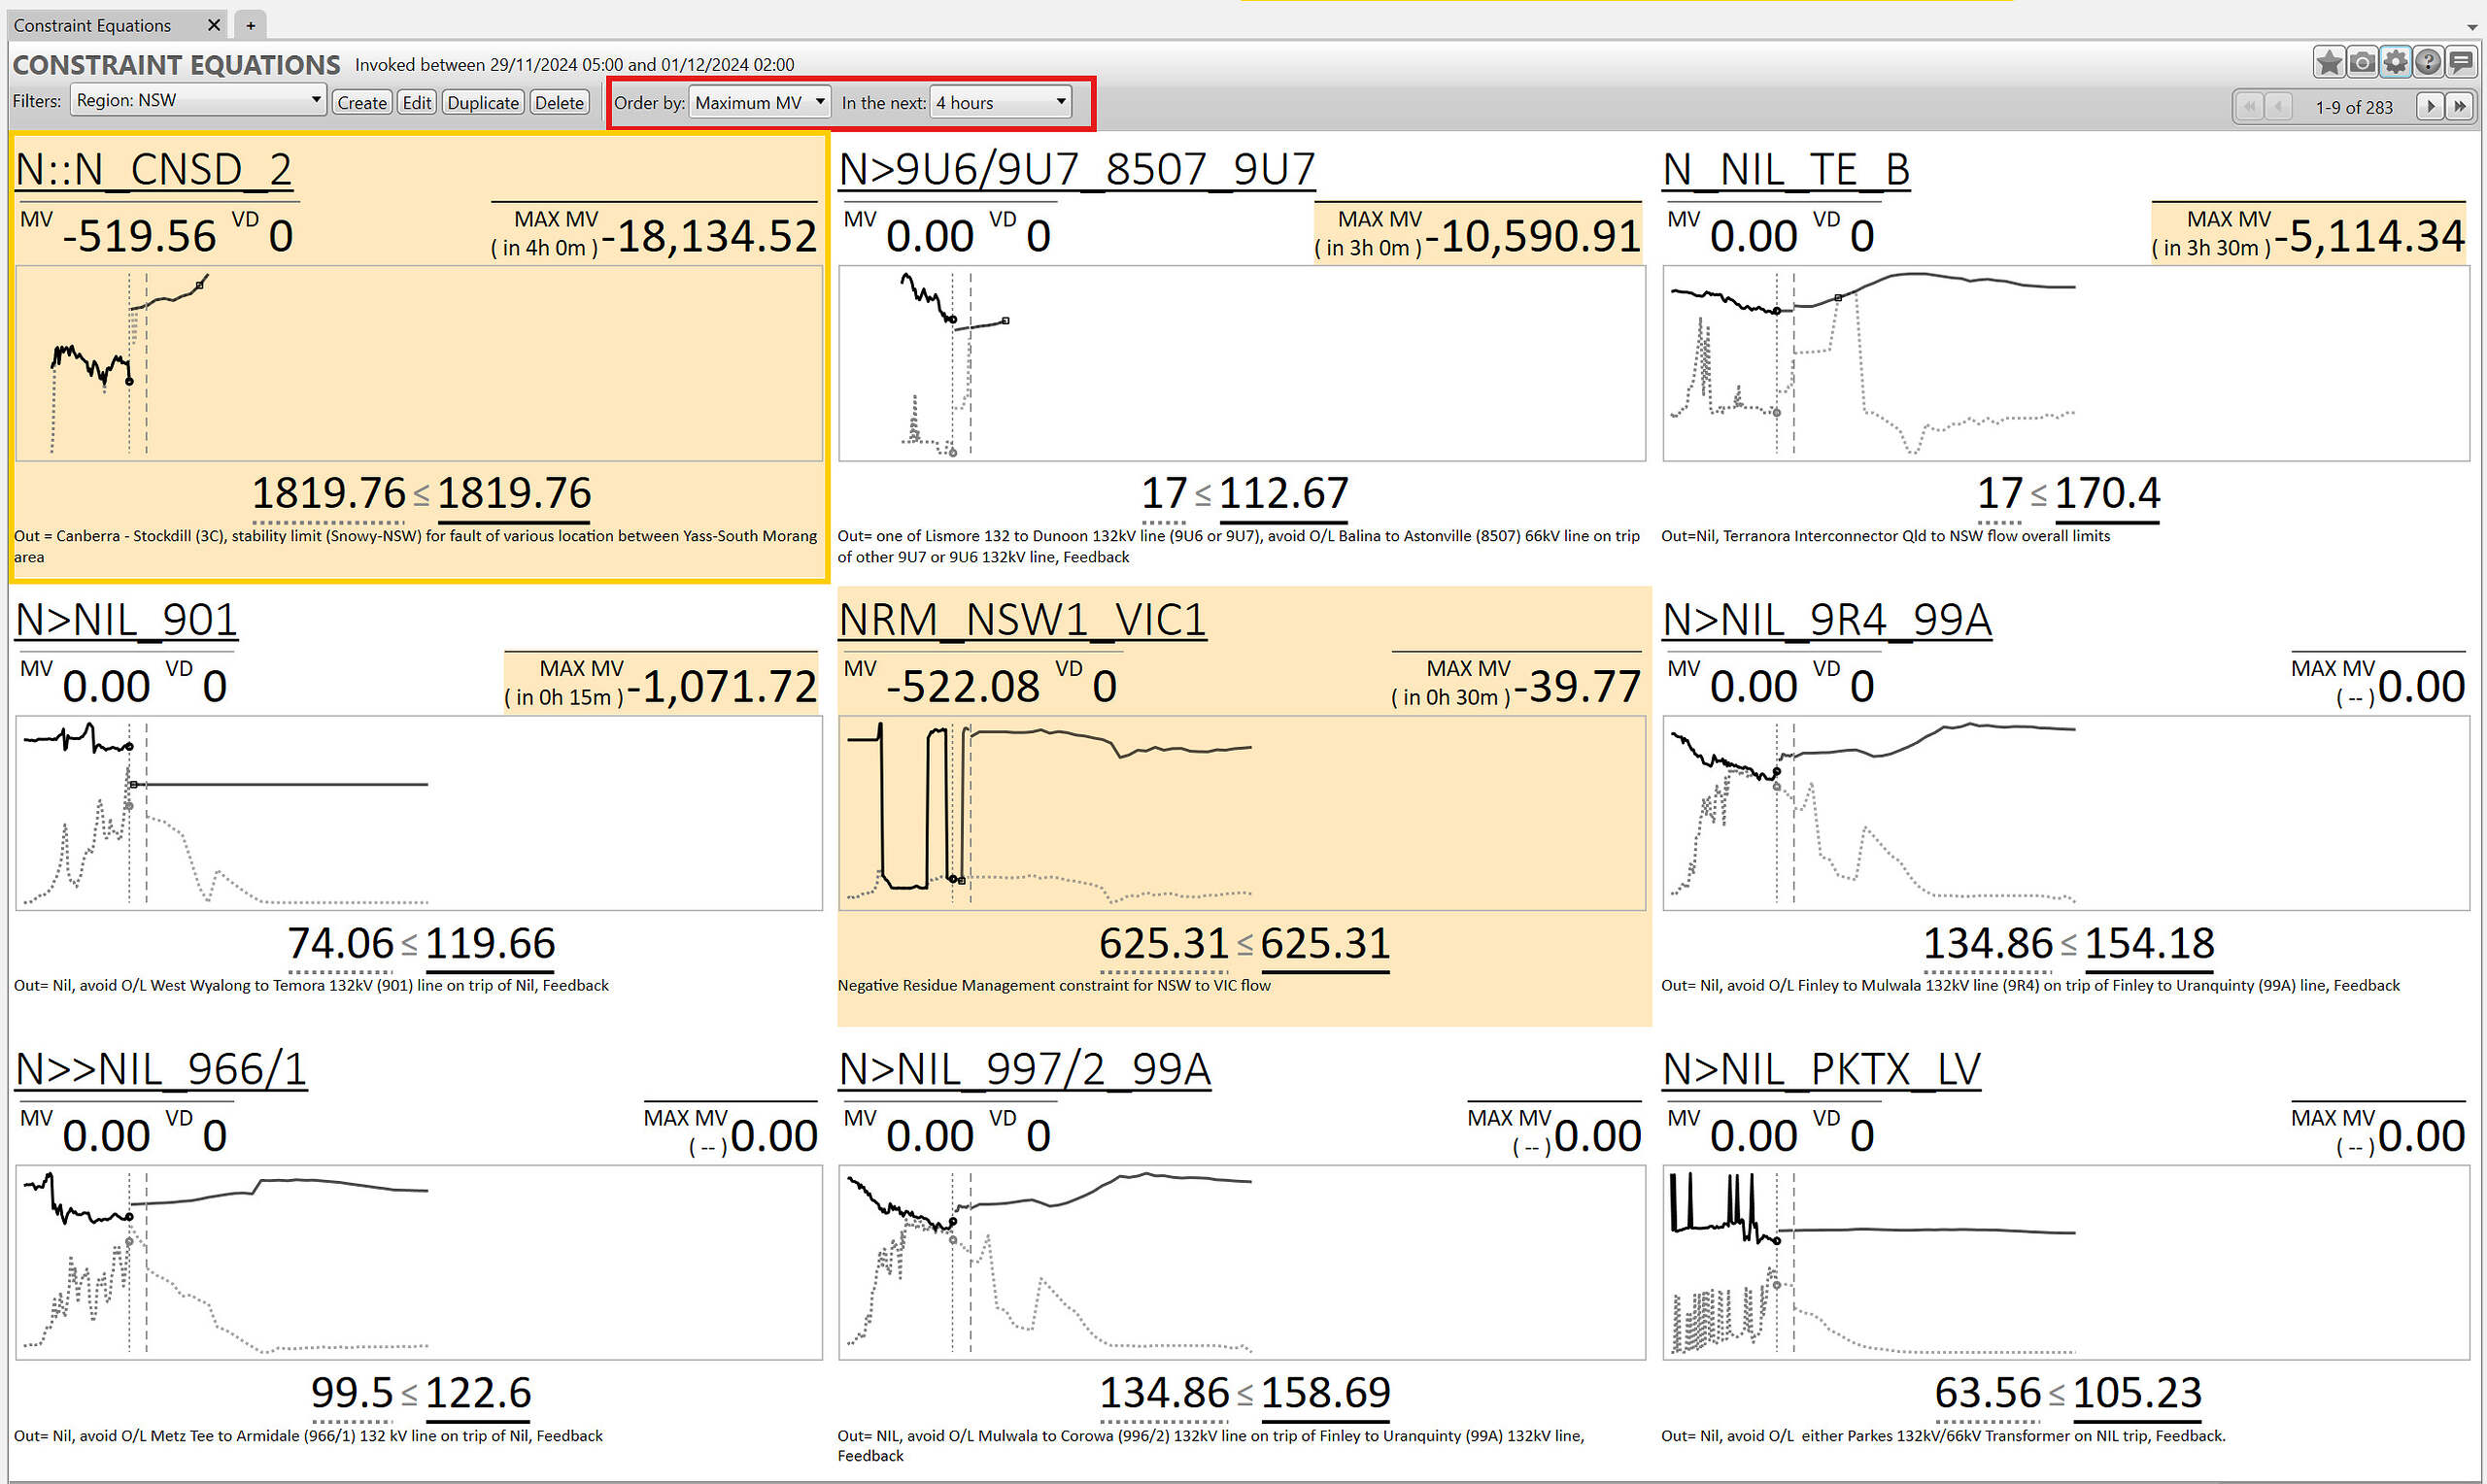
What’s going on? We’ll use ez2view to investigate. This screenshot is from ez2view at 11:00.
Using the “Constraint Equations” widget, we can apply a filter to select just those constraints affecting the NSW region, then order by “Maximum MV” over a reasonable forecast horizon, in this case, 4 hours. Here, the first result is the N::N_CNSD_2 constraint, forecast to bind with a large maximum MV of -$18,134.52 in 4 hours.
This is an outage constraint for a very small section of 330kV transmission in the ACT, the 3C line, Canberra – Stockdill, some kind of maintenance scheduled in advance, basically. The constraint aims to provide a “stability limit (Snowy-NSW) for fault of various location between Yass-South Morang area”.
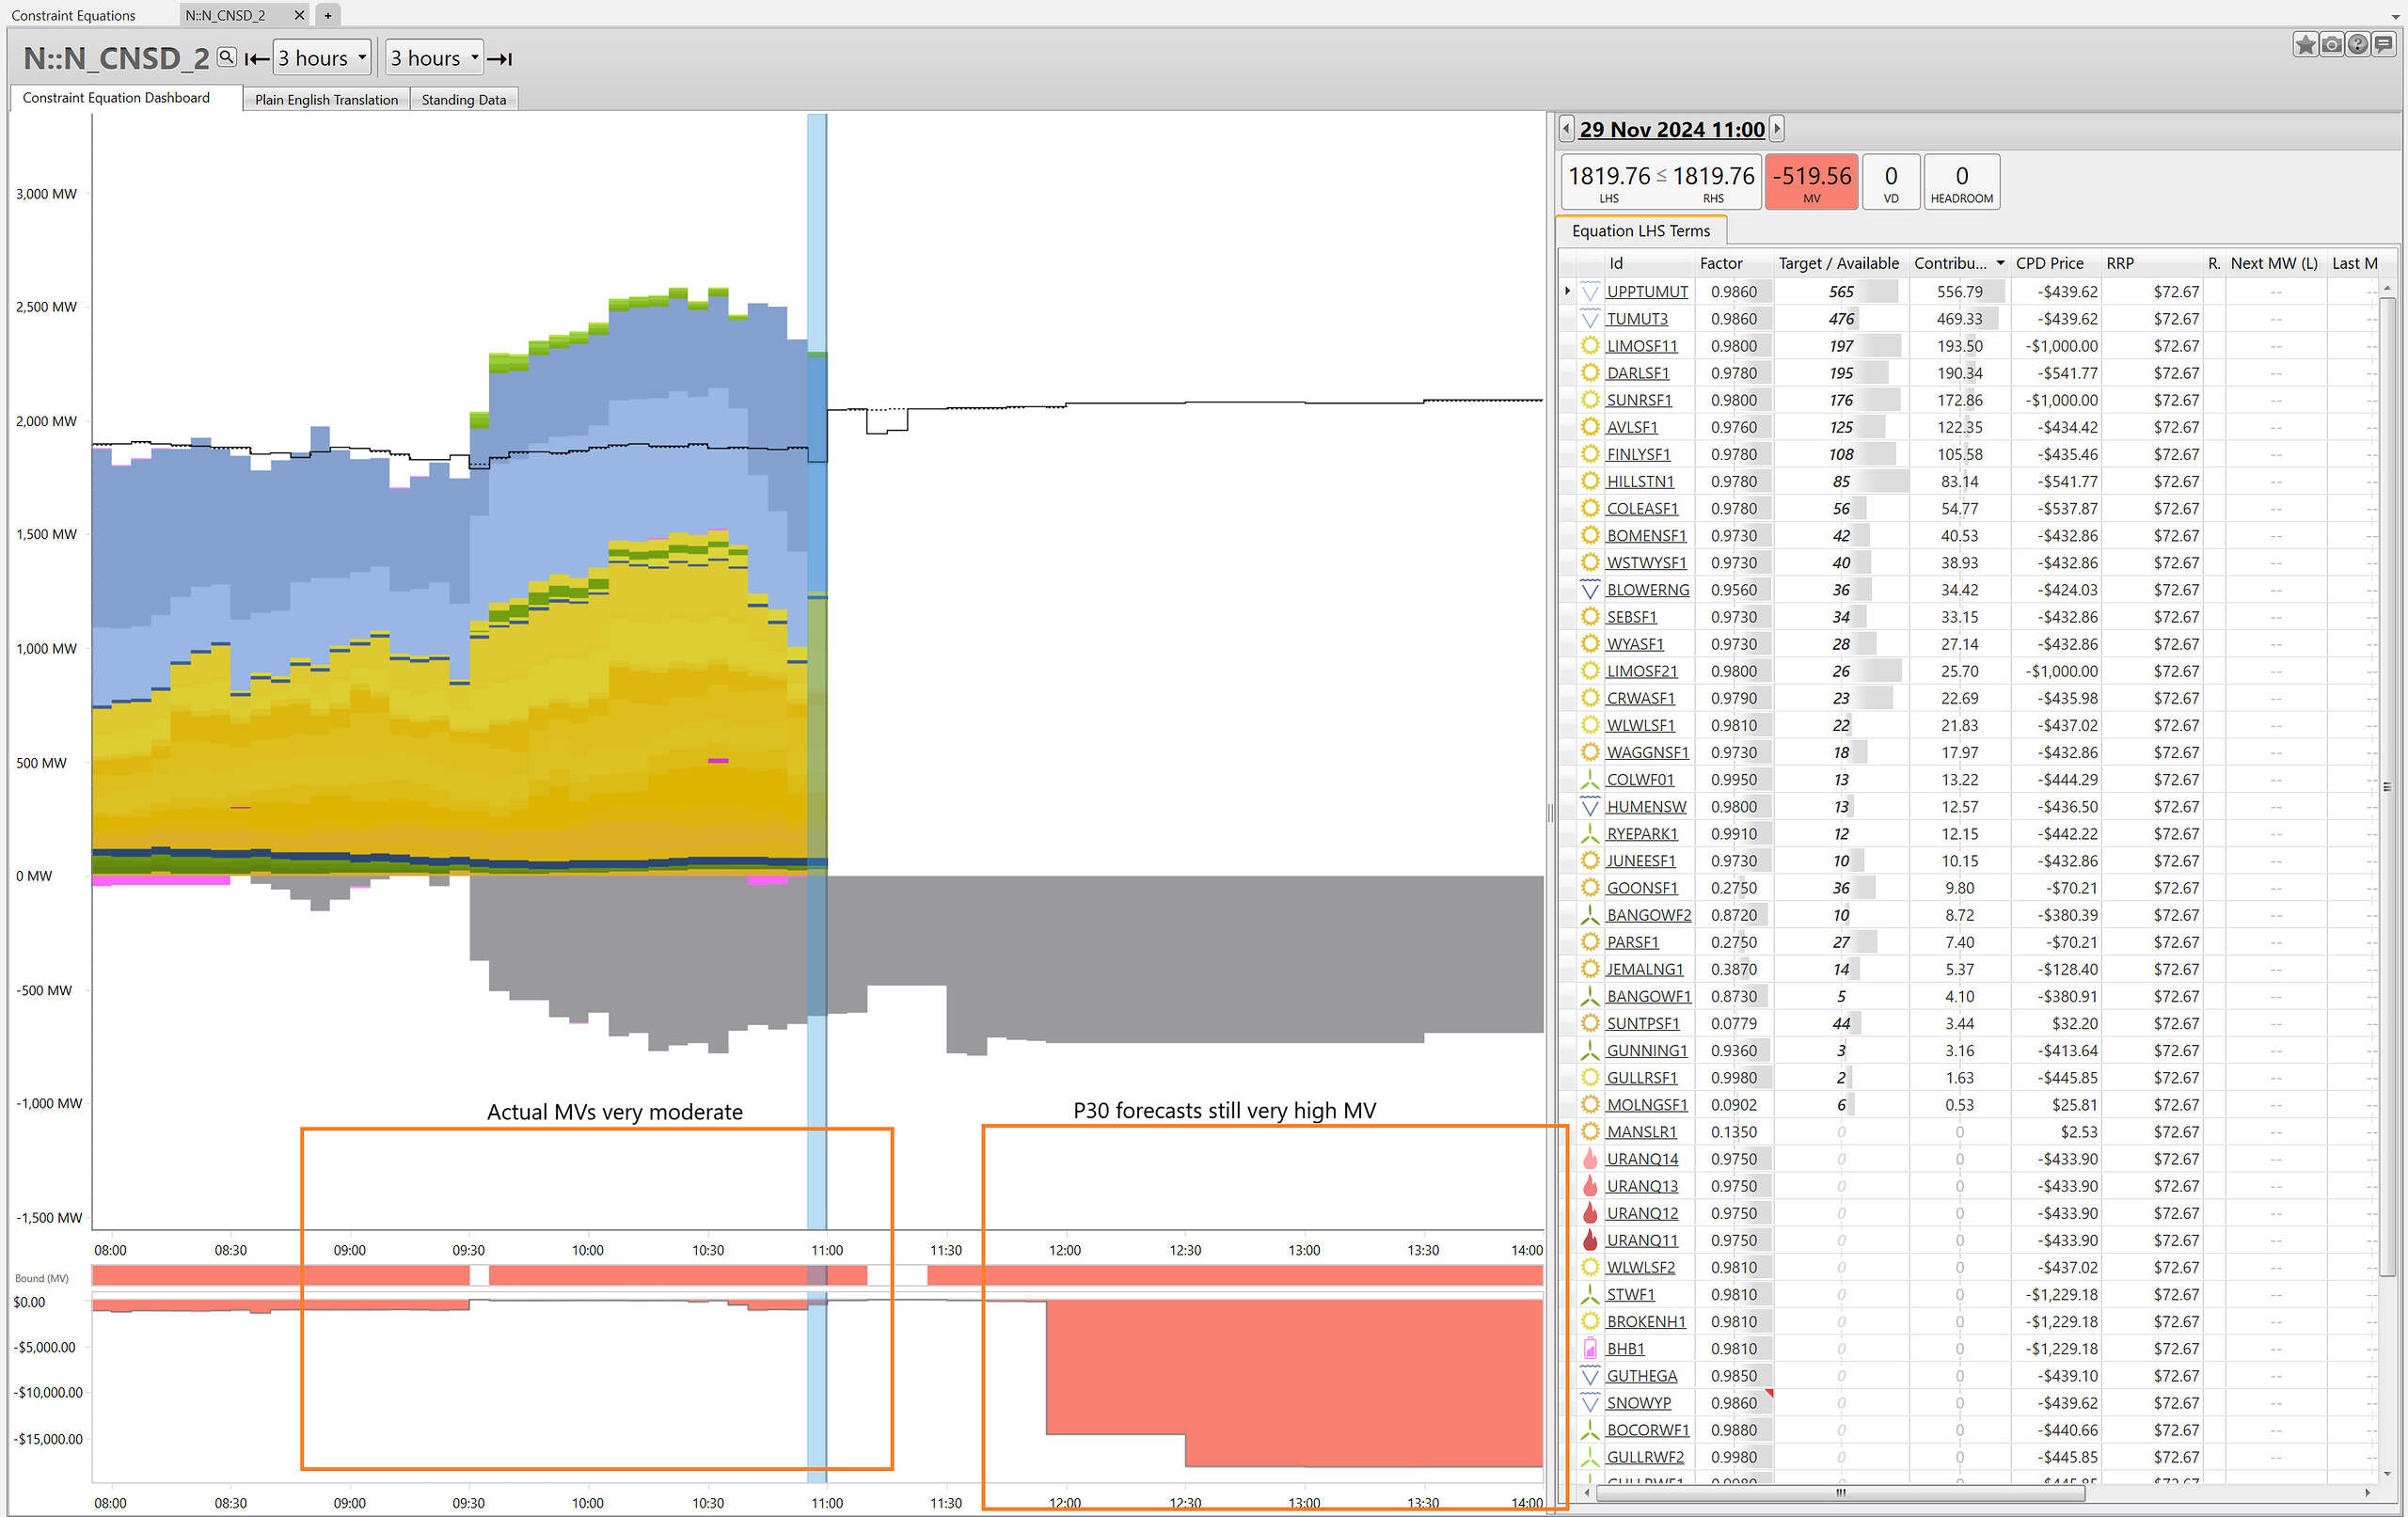
Here in “Constraint Dashboard” we can see that looking back to the actual dispatch outcomes, the marginal values of this constraint in dispatch show that it has been binding, but with continually moderate MV.
Looking into the future P30 horizon here however, the predispatch outlook is quite dire, with very high MV!
The final piece of the puzzle, looking at the “Plain English Translation” for this N::N_CNSD_2 constraint from “Constraint Dashboard” widget offers at least a partial explanation — the constraint RHS terms are vastly different in Predispatch vs Dispatch.
Essentially, NEMDE is forecasting possible outcomes based on one equation in predispatch, but a very different form of equation in dispatch, so the actual outcome in dispatch is that the constraint is not binding anywhere near as much, and so prices are remaining moderate.
|
Dispatch RHS= 1.013 x (1200 {Limit} – MVA flow on 4 330kV line at Collector – MVA flow on 5 330kV line at Yass – MVA flow from Canberra to Capital 6 330kV line – MVA flow on 61 330kV line at Crookwell – 50 {Operating_Margin}) + 0.983 x [MW flow north on the Vic to NSW AC Interconnector] + 0.976 x [Avonlie Solar Farm (254 MW)] + 0.873 x [Bango 973 wind farm] + 0.872 x [Bango 999 wind farm] + 0.981 x [Broken Hill Battery BDU] + 0.956 x [Blowering hydro (3 aggregated units)] + 0.988 x [BOCO Rock WF] + 0.973 x [Bomen solar farm] + 0.981 x [Broken Hill Solar Farm] + 0.989 x [Capital Battery BDU] + 0.978 x [Coleambally solar farm] + 0.995 x [Collector wind farm] + Crookwell 2 wind farm + Crookwell 3 Wind Farm + 0.979 x [Corowa solar farm] + 0.978 x [Darlington Point solar farm] + 0.978 x [Darlington Point Battery BDU] + 0.978 x [Finley solar farm] + 0.275 x [Goonumbla Solar Farm] + 0.998 x [Gullen Range Solar Farm] + 0.998 x [Gullen Range WF] + 0.998 x [Gullen Range WF 2] + 0.936 x [Gunning Wind Farm] + 0.985 x [Guthega hydro (2 aggregated units)] + 0.978 x [Hillston solar farm] + 0.98 x [Hume (NSW) hydro] + 0.387 x [Jemalong solar farm] + 0.973 x [Junee solar farm] + 0.98 x [Limondale 1 solar farm] + 0.98 x [Limondale 2 solar farm] + 0.135 x [Manildra solar farm] + 0.0902 x [Molong solar farm] + 0.275 x [Parkes solar farm] + 0.989 x [Queanbeyan Battery BDU] + 0.978 x [Riverina 1 Battery BDU] + 0.978 x [Riverina 2 Battery BDU] + 0.991 x [Rye Park 384 MW Windfarm ] + 0.973 x [Sebastapol solar farm] – 0.986 x [Lower Tumut pumps (3 aggregated pumps)] + 0.981 x [Silverton wind farm] + 0.98 x [Sunraysia 1 solar farm] + 0.0779 x [Suntop solar farm] + 0.986 x [Lower Tumut hydro (6 aggregated units)] + 0.986 x [Upper Tumut hydro (8 aggregated units)] + 0.975 x [Uranquinty GT unit 1] + 0.975 x [Uranquinty GT unit 2] + 0.975 x [Uranquinty GT unit 3] + 0.975 x [Uranquinty GT unit 4] + 0.973 x [Wagga North solar farm] + 0.981 x [Walla Walla solar farm #1] + 0.981 x [Walla Walla solar farm #2] + 0.973 x [West Wyalong solar farm] + 0.973 x [Wyalong Solar Farm (90 MW)] |
Predispatch RHS= 1.013 x (1200 {Limit} + 0.9648 x [Zone: CANBERRA_NSW ] + 0.9102 x [Zone: SWNSW] + 0.09707 x [Zone: CENTRAL_WESTERN_NSW ] + 188.155 {Constant} – 50 {Operating_Margin}) – 0.0186 x [Capital Wind Farm – MW forecast is negative] + 0.936 x [Cullerin Range Wind Farm – MW forecast is negative] – 0.0438 x [Beryl solar farm] – 0.05 x [Bodangora wind farm] – 0.0292 x [Crudine Ridge wind farm] – 0.0555 x [Flyers Creek Wind Farm (140 MW)] – 0.00836 x [Mt Piper unit 1] – 0.00836 x [Mt Piper unit 2] – 0.0532 x [Nevertire Solar Farm] – 0.0532 x [Nyngan Solar Farm] + 0.00871 x [Shoalhaven hydro (aggregated Bendeela and Kangaroo Valley units)] – 0.00871 x [Shoalhaven pumps (2 aggregated pumps)] – 0.0213 x [Stubbo solar farm #1] – 0.0213 x [Stubbo solar farm #2] + 0.00549 x [Tallawarra CCGT] + 0.00549 x [Tallawara B 320 MW OCGT] + 0.00809 x [Taralga Wind Farm] – 0.0532 x [Wellington solar farm] – 0.032 x [Wellington North Solar Farm (330 MW)] – 0.0138 x [Wollar 280 MW Solar Farm] + 0.0186 x [Woodlawn wind farm] |
As to why this particular N::N_CNSD_2 constraint equation is so different between dispatch and predispatch, we’d welcome further insight or comments from knowledgeable readers!


What do the 3 [Zone:…] terms represent in the Predispatch-RHS? Is a zone an aggregated value of generators in a region or is a zone expanded to a series of individual generator/load terms? All the generators/loads named in the Dispatch-RHS are in the locality of Yass/Canberra/Tumut or in SW NSW.
Yes you may very well be on to something there! There are a number of other constraints with similar constructions. Although, in this case, the magnitudes still seem a bit different.
The difference between dispatch and predispatch here was only about 200MW so in retrospect I think there’s more in play here than just the one constraint. Negative residue management playing a part too.