We’ve already posted three earlier parts in this case Study:
1) On the day, we published ‘Evening blast of spot price volatility in South Australia on Monday 23rd September 2024’ as (what we’re now calling) Part 1.
2) Earlier this week, we published ‘Taking a look inside South Australia’s lengthy run of volatility on Monday 23rd September 2024’, as Part 2:
(a) In that article we highlighted that there was a period of volatility:
i. This began at 17:50 (NEM time) with the price at $3,499.99/MWh – up from $286.89/MWh at 17:45
ii. and ended at 20:30 (NEM time) with the price at $8,800.01/MWh – before dropping to $560.04/MWh at 20:35
(b) we also highlighted that the ‘Heywood’ interconnector was running hard west for the duration of this period of volatility:
i. often during the time range above
ii. which created an ‘Economic Island’ and allowed SA prices to separate from (lower) VIC prices
(c) We also used the ‘Bids & Offers’ widget to highlight the supply stack
3) Then we posted ‘Reviewing 12 dispatch intervals in South Australia on Monday 23rd September 2024’ as Part 3:
(a) Which spanned the 17:45 to 18:40 dispatch intervals, and so highlighted some of the underlying factors
(b) Including a very thin supply stack of any volume bid in between $0/MWh and the Market Price Cap
i. and especially in the ‘green’ price ranges (from $0/MWh to $300/MWh),
ii. which traditionally would have hosted many thermal units bidding their short run marginal costs
iii. and hence delivering a ‘stickiness’ of prices in that range.
iv. whereas in contrast now prices more often sail right through from negative prices to sky-high prices and not much in between (as one outcome of this energy transition).
(c) In this article we also saw two constraint equations bound:
i. We saw the ‘V^SML_BUDP_3’ Constraint Equation that’s bound, affecting the flow on the Murraylink interconnector
… we might look at this more in another subsequent article
ii. We also saw the ‘S_PPT+SNPT+BLVR_220’ Constraint Equation, affecting the three units (BOLIVPS1, PPCCGT and SNAPPER1) .
In this article, we’ll take a closer look at the ‘S_PPT+SNPT+BLVR_220’ Constraint Equation, to see how this impacted on Market Outcomes…
(A) Some background to Constraint Equations
Remember that NEMDE (the NEM Dispatch Engine) is an LP*-based dispatch optimisation engine.
* note that LP stands for Linear Program
1) This utilises a series of (implicit and) explicit constraint equations to translate the complexities of the physical grid, and aspects of the market rules, into mathematical terms
2) The Implicit Constraints are things like:
(a) DUID Target can’t be more than Maximum Capacity
(b) Increase in Target for unit (i.e. Target – InitialMW) can’t be more than the ramp rate up over 5 minutes.
etc…
3) The Explicit Constraints are the things represented in Constraint Equations you can see in the EMMS, and which software like ez2view makes more understandable through widgets like the ‘Constraint Dashboard’ widget.
(B) About the the ‘S_PPT+SNPT+BLVR_220’ Constraint Equation
So let’s use the ‘S_PPT+SNPT+BLVR_220’ Constraint Equation to illustrate some of these concepts….
B1) Details of the Constraint Equation
Briefly, let’s understand that the form of this particular constraint is as follows…
B1a) The form of the Constraint Equation
Looking at the formula itself (in the ‘Constraint Dashboard’ widget, but not shown here in all the images) …
LHS ≤ RHS
… where:
i. the Left-Hand Side (LHS) contains all the terms that NEMDE tries to influence in the co-optimisation process assembled in a linear equation
… in this case
LHS = 1.0 x Target (BOLIVPS1) + 1.0 x Target (PPCCGT) + 1.0 x Target (SNAPPER1)
ii. the Right-Hand Side (RHS) reflects the things that generally NEMDE can’t control, but essentially treats as an constant for the given dispatch interval.
… in this case:
Default RHS value= 220
… believe me, they are often much more complex than that!
B1b) Other Details
Extra details of the Constraint Equation are:
Description: ‘SA Pelican Point + Snapper Point generation +Bolivar PS<= 220 MW’
Reason: ‘Upper limit on Pelican Pt + Snapper generation+ Bolivar PS’
… neither tell us much more than the LHS does, in this instance.
B1c) Invocation (the fancy term for ‘in use’)
Remember that Constraint Equations are ‘invoked’ in Constraint Sets (because the network is often more complex than linear in form).
In this case the ‘Constraint Dashboard’ widget shows the following additional details
i. It’s invoked in the ‘S-PAPG’ constraint set
ii. Which relates to a network outage of ‘Para to Parafield Gardens West 275kV’ in South Australia
iii. Which …
1. at that time, was scheduled to be invoked through until 17:00 on 1st October 2024 (and then again for a couple durations in October).
2. and had been invoked since 18th September 2024 (in that outage), and in the past as well.
B2) Specific Dispatch Intervals
In our Part 3 of the Case Study, we started at the 17:45 dispatch interval, as that was just before the start of the run of evening volatility.
However in this article we need to look back earlier in time, because of a few earlier developments. Because of this, we’ll be skipping over a number of dispatch intervals in intervening periods…
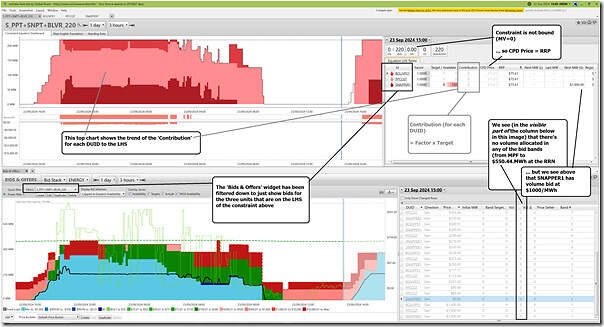
The 15:00 Dispatch interval
At the 15:00 dispatch interval (NEM time) we can sum up the story as ‘all’s quiet’.
With all of the images below (there are quite a few!) remember to click on the image to open in larger resolution (readable!) form in another tab.
Specifically:
1) All three units have a 0MW Target
2) This is because:
(a) Two units (PPCGT and BOLIVPS1) have no volume offered at all; whilst
(b) SNAPPER1 has 150MW offered to NEMDE, but at and above +$1,000/MWh at the RRN
… which is ‘out of the money’ – hence a 0MW Target
3) As a result of the 3 lots of 0MW Target, the LHS calculates to 0MW and the constraint equation is not bound.
So let’s step forward ….
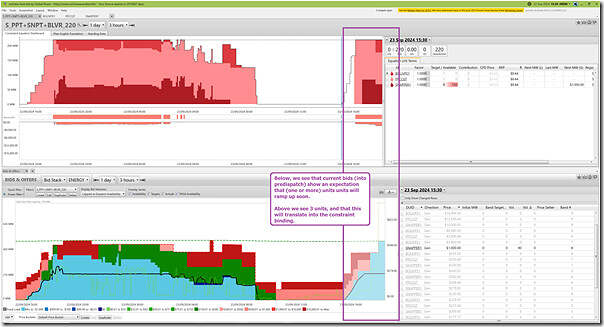
The 15:30 Dispatch interval
At this point we see nothing has changed, from a ‘current dispatch interval’ perspective:
But we do see that the restart of the three units is expected to happen sequentially – one, then two, then three in the two charts in predispatch as highlighted. It is forecast at this point that the constraint will bind, within the next hour.
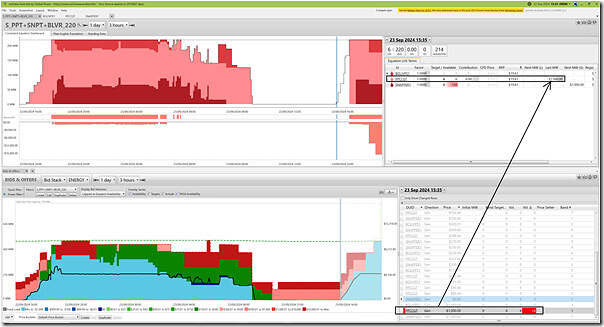
The 15:35 Dispatch interval
Stepping forward 5 minutes and we see PPCCGT starts up:
We see:
1) The generator adds 6MW to its bid band at –$1,000/MWh, which NEMDE accepts gratefully and allocates a Dispatch Target to.
2) On the LHS of the constraint:
(a) this means (rinsing through the factor of +1.0) the contribution is 6MW and hence the LHS is 6MW
(b) with LHS << RHS the constraint is a long way from binding.
So let’s skip a few dispatch intervals …
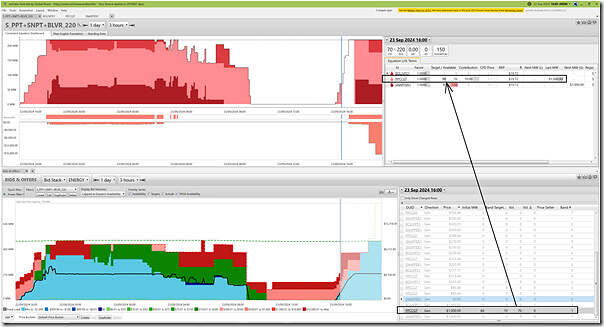
The 16:00 Dispatch interval
At 16:00, the PPCCGT unit is up to 70MW Availability (and Target):
The other two units have not noticeably moved…
The 16:30 Dispatch interval
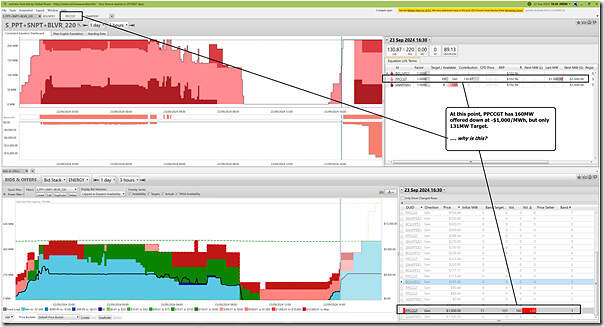
Six dispatch intervals later, the PPCGT unit has 160MW offered down at –$1,000/MWh … but we see only 131MW Target (i.e. NEMDE seems to be leaving 29MW of ‘cheap’ energy on the shelf), and we wonder why that’s the case?
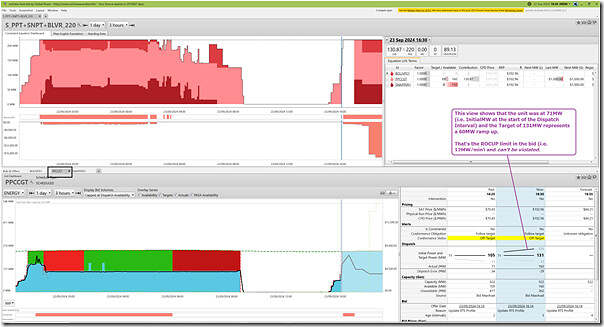
So we flip to the ‘Unit Dashboard’ widget in the ez2view software to see more detail about the PPCCGT unit:
As noted in the annotation, we see the unit received a ramp up signal of 60MW (or 12 MW/minute) from 71MW (InitialMW) to 131MW (Target). That ROCUP rate was as bid by the unit as is one of those ‘Implicit Constraints’ noted above – and, importantly, ramp rate constraints will never be violated by NEMDE (i.e. they have a very high implied ‘Weight’).
So that explains why some of that ‘cheap’ energy offered in this dispatch interval can’t be allocated a target…
The 16:35 Dispatch interval
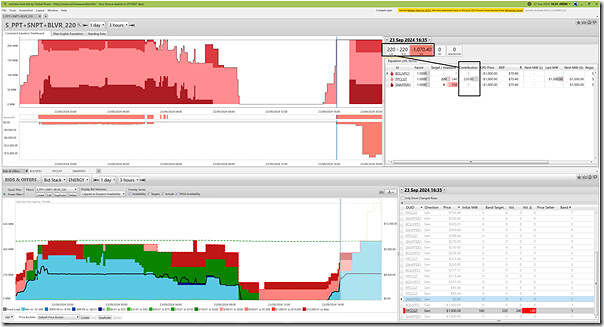
Stepping forward we might expect to see a further ramp up in output (utilising that 12MW/min ROCUP rate) would absorb all of that ‘cheap’ energy from PPCCGT in the Target 5 minutes later … but that’s not the case!
Instead, we see that the Target is now capped at 220MW …
1) … because the LHS of the constraint equals the RHS of the constraint
2) … which means that the constraint is bound
3) … and, as a result, has a non-zero Marginal Value.
4) We see that, as a result, the bound constraint drives the CPD Price for all three units down to –$1,000/MWh
The constraint is full … and that’s even before the other two units (BOLIVPS1 and SNAPPER1) begin to ramp up!
The 17:00 Dispatch interval
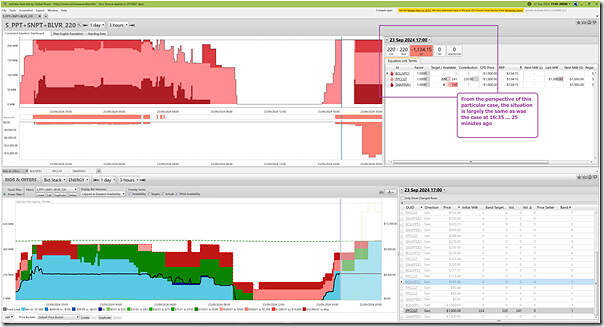
So we step forward 25 minutes to the 17:00 dispatch interval:
The situation is largely the same.
Starting from this point, we’ll walk through each dispatch interval in turn…
The 17:05 Dispatch interval
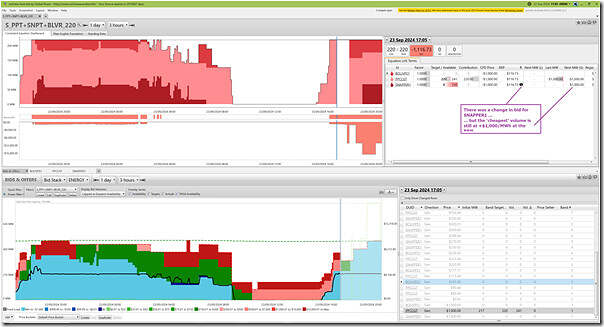
Stepping forward 5 minutes, we see that there was a change in bid (on this occasion a rebid) for SNAPPER1 ….
However (because the cheapest volume offered was still at +$1,000/MWh at the RRN, there’s no change to dispatch outcomes.
The 17:10 Dispatch interval
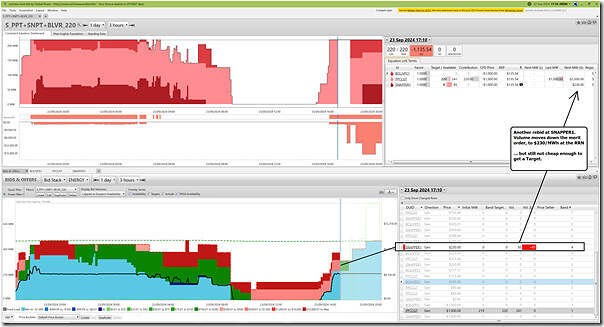
Five minutes later another rebid at SNAPPER1:
Volume offered is reduced (from 150MW to 85MW), and that 85MW is also offered at a ‘cheaper’ price band (i.e. $230/MWh at the RRN). But it’s still not cheap enough to be dispatched, noting that the CPD Price for the unit is down at –$1,000/MWh due to the bound constraint.
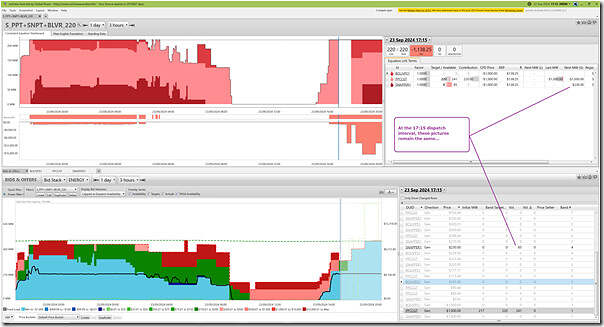
The 17:15 Dispatch interval
Another 5 minutes later and the picture remains the same:
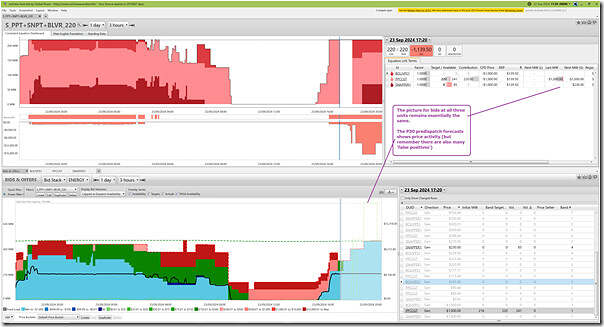
The 17:20 Dispatch interval
Another 5 minutes on, and there’s no substantial change:
Note that we know (in hindsight, which is a wonderful thing!) that there was volatility that began within the hour. There is an expectation of volatility shown in the P30 predispatch forecast … but remember that there are many instances where:
1) Forecasts have been a ‘false positive’ … leading many to believe that the AEMO’s forecasts were somehow ‘wrong’
2) A more correct/informed view:
(a) is that the AEMO P30 price forecasts are one of the forecasts published by AEMO intended to elicit a response
(b) so the fact that some market response meant the price forecast often does not eventuate is a ‘Very Good Thing™’
(c) as was loudly noted in ‘Operating in the NEM’ session during All Energy 2024
… yes, it was me who clapped loudly at one of the speaker’s answer to that question from the floor!
So keep in mind that the RRP at the time (‘only’ $138.25/MWh) would likely not be enough to pay back the SRMC of the two other peaking units that are not running at this point…
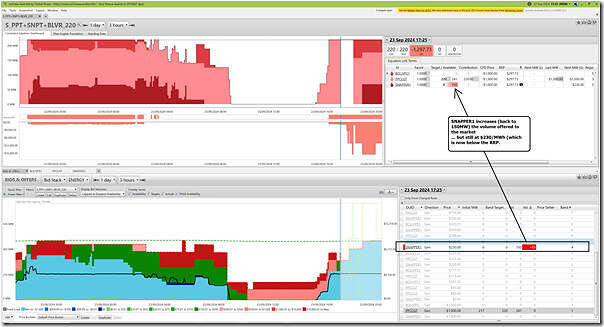
The 17:25 Dispatch interval
Five minutes on and the puzzle starts to get more interesting…
We see that:
1) SNAPPER1 increases (back to 150MW) the volume that it’s offered to NEMDE;
2) This remains offered at $230/MWh at the RRN
3) We note that the RRP is now above this level (at $297.73/MWh)
(a) Which would ordinarily* see the unit receive a Target
* note … ‘ordinarily’, with quite a few caveats!
(b) But you’ll see that this is not the case here.
4) Which is a reminder that the ‘price to beat’ for these units is the (constraint depressed) CPD Price, which sits down at –$1,000/MWh at the RRN.
… so SNAPPER1 could be seen as being ‘constrained down’ in this dispatch interval.
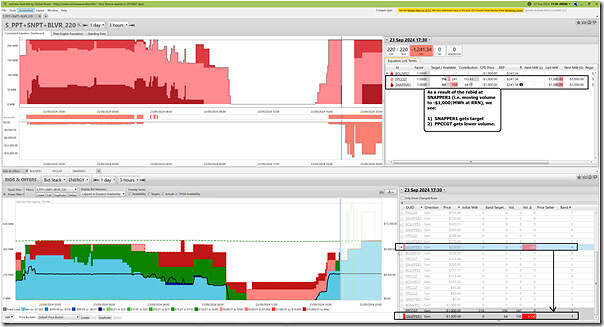
The 17:30 Dispatch interval
At 17:30 we start to get to much more complex dispatch intervals:
As we can see in this snapshot:
1) SNAPPER1 moves its 150MW of Availability from $230 (at the RRN) to –$1,000 (at the RRN)
2) Because this is ‘at or below’ the (constraint depressed) CPD Price for the unit:
(a) it should get a target
(b) but this is where the complexity starts
i. because PPCCGT is already producing the 220MW that forms the aggregate limit of output across the three units
ii. so that means giving a Target to SNAPPER1 means that PPCCGT gets less
3) Now Marcelle already thankfully explained ‘Who gets to run when everyone bids the same? A crash course in disorderly bidding and tie-breaking’ back in 2022 … including the excerpt from Clause 3.8.16 of the NER has the tie-breaking principle:
“Equal priced dispatch bids and dispatch offers … the MW quantities specified in the relevant price bands of those dispatch bids or dispatch offers must be dispatched on a pro-rata basis, where this can be achieved without imposing undue costs on any party, or violating other constraints.”
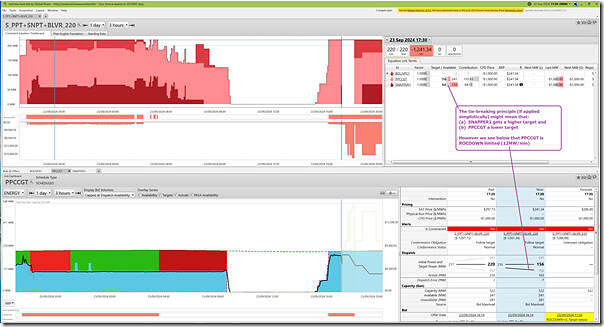
4) So my simplistic read of this suggests that the logic would work as follows…
(a) Total Volume offered at –$1,000 = 241MW + 150MW = 391MW
(b) Total RHS allowance translating back to Targets (remembering this is easy as Factors are all +1.0) = 220/391 = 56%
(c) So that should mean that:
i. PPCCGT gets 56% of 241MW = 136MW
ii. SNAPPER1 gets 56% of 150MW = 84MW
(d) But wait, that’s not what we see … instead we see:
i. PPCCGT gets 156MW … which is higher than 136MW
ii. SNAPPER1 gets 64MW … which is lower than 84MW
5) In this case we can see, using the ‘Unit Dashboard’ widget in the ez2view software for the PPCCGT unit that ramp rates rear their head again … this time ROCDOWN:
(a) The ROCDOWN rate for PPCCGT in this dispatch interval is -12MW/min
(b) So that means a Target of 156MW … which is:
i. 60MW down from the 216MW InitialMW
ii. Or -12MW/min.
(c) That also then means that the available space for SNAPPER1 is only 64MW
… i.e. the 220MW (RHS limit) – 156MW (contribution from PPCGT taking into account the LHS Factor of +1.0).
Complex, right!?
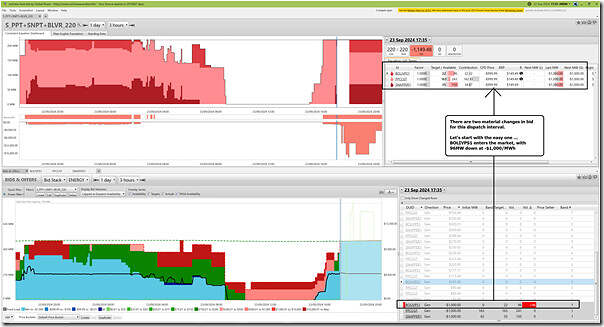
The 17:35 Dispatch interval
Hold onto your hats, because 17:35 becomes even more complex…
Without going into as much detail as above, we see that:
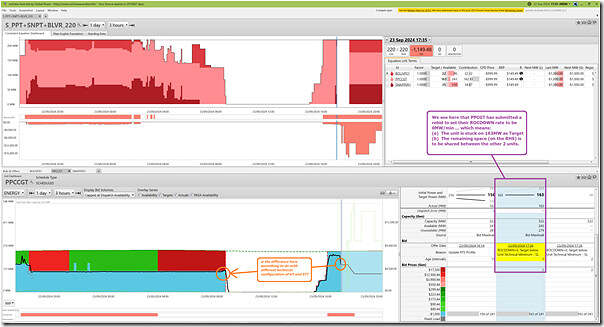
1) BOLIVPS1 enters the market, with 96MW added to the –$1,000/MWh bid band.
(a) the headline here is that there’s now 489MW of Available Capacity across 3 units, all squabbling for 220MW of available RHS on the constraint.
(b) In this dispatch interval the RRP is $149.99/MWh … but we know (ah, that hindsight thing) that the price goes ballistic shortly, so the opportunity cost on missing out on volume (hence spot revenue) is going to be enormous!
(c) something about Camel and ‘eye of the needle’ comes to mind?!
2) Simplistically applying Marcelle’s tie-breaker explanation what we would expect to happen would be:
(a) The new entrant (BOLIVPS1) to go up; and
(b) The two existing producers (PPCCGT and SNAPPER1) to each go down.
… but look at the data above and see that:
i. this is not the case.
ii. specifically, PPCGT remains steady with a Target of 163MW … whilst SNAPPER1 goes down by the same amount (-22MW) that BOLIVPS1 goes up (+22MW).
Wait, what?
So let’s again use the ‘Unit Dashboard’ widget in the ez2view software for the PPCCGT unit that ramp rates rear their head again … again this time ROCDOWN:
As noted on the image:
1) The PPCCGT unit has submitted a rebid:
(a) Which lowers their ROCDOWN rate (which you remember was –12MW/min) to be 0MW/min
(b) this was in a rebid received at the AEMO at 17:26 so taking first effect in the ~17:30 NEMDE run for the 17:35 dispatch interval
2) The effect of this rebid is:
(a) for PPCGT it effectively puts a floor on the PPCGT target
… i.e. Target (163MW) = InitialMW (163MW)
(b) for the other two units, that means the combined target is shared for the remainder of the RHS:
i. RHS (220MW) – PPCGT (163MW) = 57MW
ii. So 22 (of 96MW for BOLIVPS1) and 35 (of 150MW for SNAPPER1).
3) The rebid reason given for this rebid was ‘Target below Unit Technical Minimum’….
(a) Without slipping down that rabbit hole, I am hearing echoes of an AEMC forum back in 2014 or 2015 at a Forum held during the ‘Bidding in Good Faith’ deliberations – during which:
i. Some were vocal that rebids should not be able to change ramp rates;
ii. Whilst there was strong push-back from some generators who clearly made the point that there might be occasions when it was necessary to do so
… perhaps like this occasion?
(b) Keen eyed readers will also see in the trended bid stack chart above for the PPCGT unit (highlighted in orange) that the level of unit output pertaining to the reset of ROCDOWN = 0MW is actually above the level of output seen the last time the unit ran. This will obviously prompt questions – I don’t know what the answer is, but wonder:
i. Is the difference something to do with different configurations within the CCGT assembly of GTs and ST?
ii. Or was the rebid placed with respect to what the P5 predispatch target was going to be for the 17:35 dispatch interval (i.e. before the rebid)?
iii. Or was it something else?
Perhaps some more learned reader can help us out (e.g. in comments below)?
Suffice to say, this ‘simple’ example illustrates that the NEM is a complex place!
The 17:40 Dispatch interval
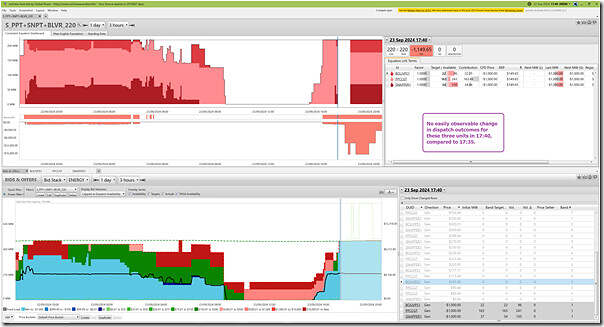
Moving right along, we see that the wash-up for the 17:40 dispatch interval is similar to 17:35, with the same issues occurring:
The 17:45 Dispatch interval
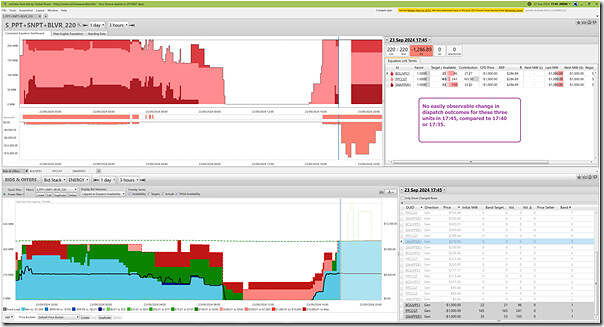
The picture looks quite similar for 17:45:
The 17:50 Dispatch interval
At this dispatch interval (as we saw in Part 3 of this Case Study) the price spikes to $3,499.99/MWh – up from $286.89/MWh at 17:45.
(C) Summing up
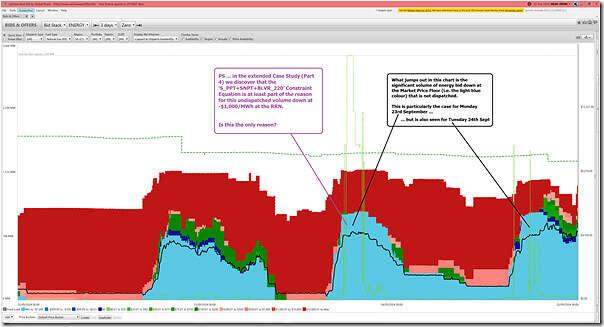
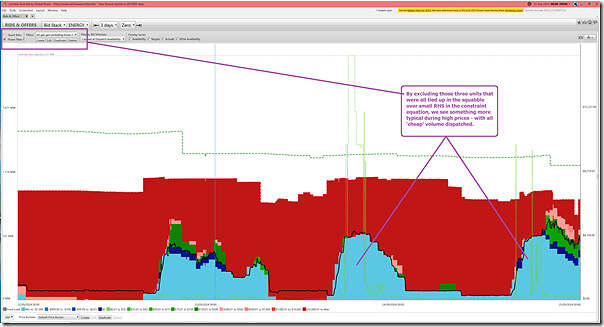
So, bringing it back almost full circle, in Part 2 we wondered why there was considerable volume of gas-fired generation that was bid down at –$1,000/MWh but yet which was not dispatched. This was shown in this trended Bid Stack from ‘Bids & Offers’ widget in ez2view:
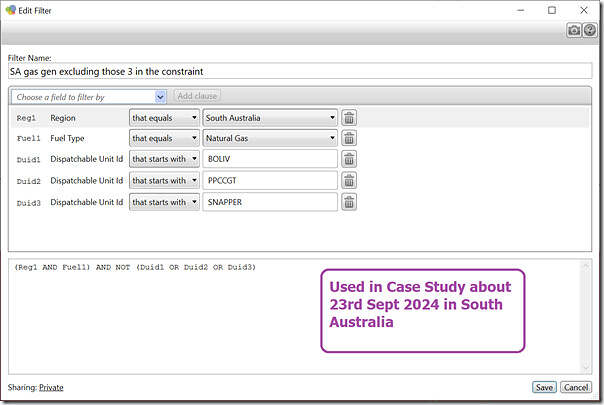
I wonder if the ‘S_PPT+SNPT+BLVR_220’ Constraint Equation is the only reason why there’s Gas-Fired Generation bid down at –$1,000/MWh at the RRN that’s not dispatched? One way of checking this is via the modified filter below, in which we look at using this ‘Power Filter’ for the bids as follows:
This gives us the following picture of ‘net’ volumes of bids from gas-fired generation:
So that’s where we’ll leave this Part 4 in the Case Study …


Terrific explanation of the events, and a nice outline the linear program behind NEMDE by zooming in on “simple” constraints. Perhaps not the points you intend to make, but it does serve as a reminder for
1) how it is becoming more common (or is already the baseline case) for it to be inaccurate to analyse electricity markets with whole-of-market bid-stack / merit-order framework. Assuming away binding constraints is assuming away reality.
2) that the system-wide impact and consequently economic value of injections at different locations (and by different technologies) at the same time within a NEM region can significantly differ. (I’ll spare everyone a rehash of the outcomes and incentives that follow from zonal market designs — it was probably all best understood and explained 20+ years ago! https://scholar.harvard.edu/whogan/files/nezn0227.pdf )