Yesterday we published ‘Taking a look inside South Australia’s lengthy run of volatility on Monday 23rd September 2024’, as Part 2 of a Case Study into what happened on Monday 23rd September 2024 in South Australia.
In this follow-on article, we take the next step in understanding what happened, and why…
(A) The run of prices
With respect to price outcomes, we sum up Part 2 as follows:
| During the day on Monday 23rd September 2024 |
Synopsis of SA price outcomes |
|---|---|
|
Early morning. |
There were some elevated prices through until sunrise – but that’s not our focus here. |
|
Sunlight hours. |
High yield of solar PV (particularly rooftop PV) drove prices down, and exports from SA to VIC. |
|
Evening. |
It was evening volatility where we will focus:
(a) This began at 17:50 (NEM time) with the price at $3,499.99/MWh – up from $286.89/MWh at 17:45 (b) and ended at 20:30 (NEM time) with the price at $8,800.01/MWh – before dropping to $560.04/MWh at 20:35
|
|
Into the night. |
As noted in Part 2, the price continued to bounce up to approx $1,000/MWh through until 23:05. |
(B) Exploring some dispatch intervals
With a collage of widgets in ez2view, and Time-Travel back to these evening periods, we take a look at what’s visible over dispatch intervals beginning 17:50 (NEM time) … i.e. just before prices jumped above $1,000/MWh:
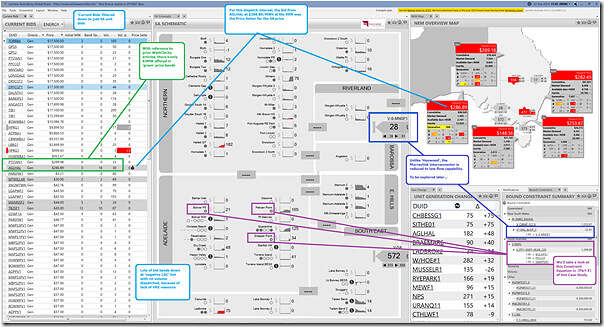
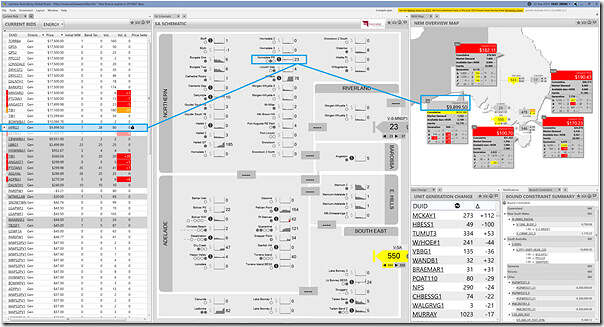
17:45 dispatch interval
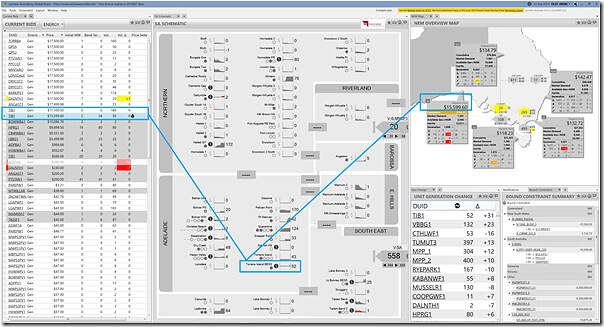
In this collage, we include a number of widgets:
1) The ‘Current Bids’ widget on the left is filtered down to only show bids for ENERGY from SA units, and is stacked from low price to high price for the dispatch interval;
2) The ‘SA Schematic’ widget shows trended FinalMW for all units in South Australia
… remembering that (since IESS) all consumption is a negative quantity
3) The ‘NEM Overview Map’ widget provides an overview
4) Underneath that shows:
(a) The ‘Gen Change’ widget shows change in FinalMW from the prior dispatch interval to this one; and
(b) The ‘Bound Constraints’ widget shows constraint equations currently bound in this dispatch interval, and the Constraint Sets they are invoked in.
The display is annotated to highlight a number of things:
In particular note:
1) In the bid stack, there is almost no volume bid in ‘green’ price ranges (i.e. between $0/MWh and $300/MWh):
(a) Which is not a surprise, given prior discussion – such as in this ‘Updated trend of ‘ENERGY’ bids in red, green and blue’ article from April 2024.
(b) and which helps explain the steep price escalation seen through the evening with just slight changes in the supply-demand balance.
2) For this particular dispatch interval, we see that the AGLHAL unit has a primary role in setting the Dispatch Price in South Australia for the 17:45 dispatch interval
…. noting this is separated from the VIC Price because of the ‘Economic Island’ being formed.
3) We see the role of the interconnectors being constrained:
(a) In Part 1 we noted that flows west on ‘Heywood’ were strong, but up at the Export Limit;
(b) But we did not comment on Murraylink, which is flowing west at a much lower level, due to the ‘V^SML_BUDP_3’ Constraint Equation that’s bound
…. more about that one in a subsequent piece of this Case Study.
4) We also see three units in particular that are of interest:
(a) In this dispatch interval, all three units (BOLIVPS1, PPCCGT and SNAPPER1) have output;
(b) But they are all subject to the ‘S_PPT+SNPT+BLVR_220’ Constraint Equation that’s bound
…. more about that one in a subsequent piece of this Case Study.
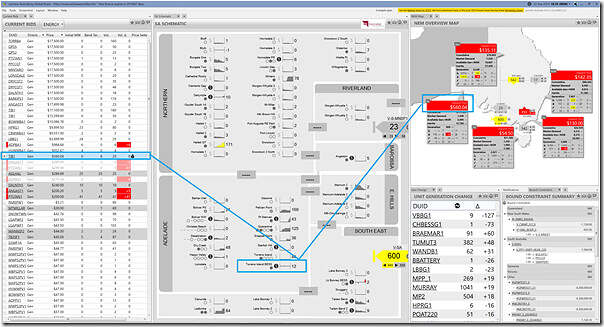
17:50 dispatch interval
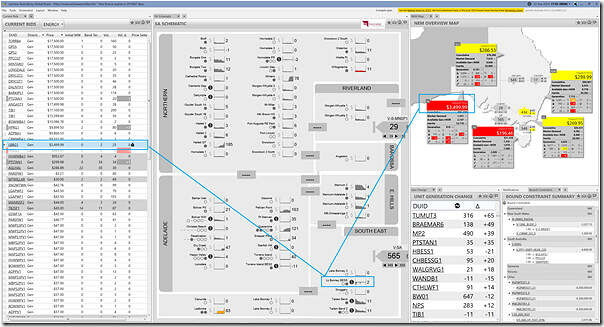
Moving along to the next dispatch interval, the price spikes:
The price is set by the bid at Lake Bonney BESS.
17:55 dispatch interval
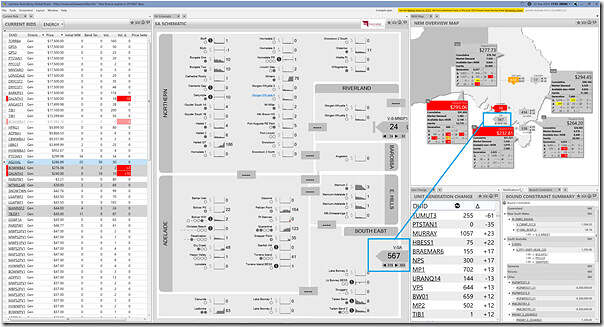
The price drops when the ‘Heywood’ link unbinds:
This is because the ‘Economic Island’ no longer exists … it’s a Price Setter outside of SA that sets the ENERGY Price in SA (so not shown in the filtered ‘Current Bids’ widget in the image).
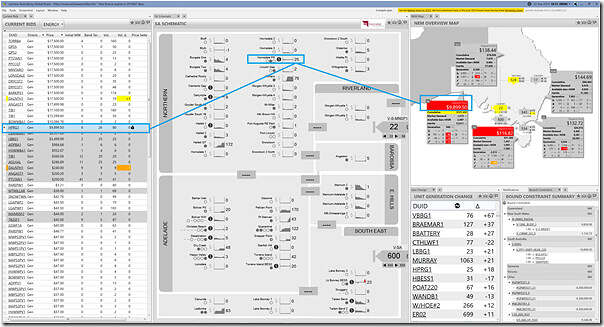
18:00 dispatch interval
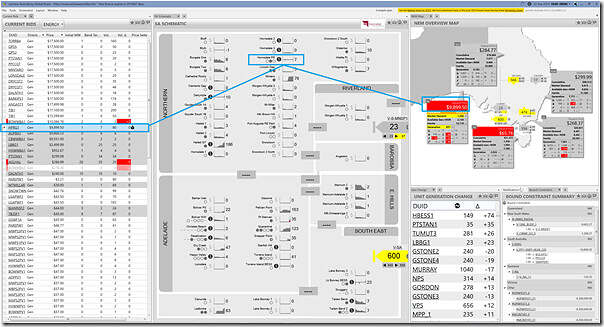
The Heywood link again binds, and prices separate again:
In this instance, its the Hornsdale Power Reserve that sets the price with its bid at $9,899.50/MWh at the RRN
… note that there’s not much volume between that (below) and the bid for Lake Bonney BESS we saw before then (not many price bands with volume in them). That’s pretty normal up at the spicy end of the price curve.
18:05 dispatch interval
There’s quite a bid changes taking effect for the 18:05 dispatch interval (i.e. the $ symbols on the schematic) … but note that invariably some of them will be ‘noise bids’.
It’s still Hornsdale Power Reserve setting the price.
18:10 dispatch interval
At 18:10, prices drop substantially (even with Heywood still bound at its Export Limit), with Torrens Island BESS setting the price:
We can see some movement of bid volumes for Angaston and Port Stanvac, amongst others.
18:15 dispatch interval
The price spikes again, and we’re back to Hornsdale Power Reserve setting the price.
Note that the ‘Market Demand’ for South Australia has increased:
1) From 1,509MW at 18:10;
2) To 1,573MW at 18:15 … which would be one factor contributing to the jump in price.
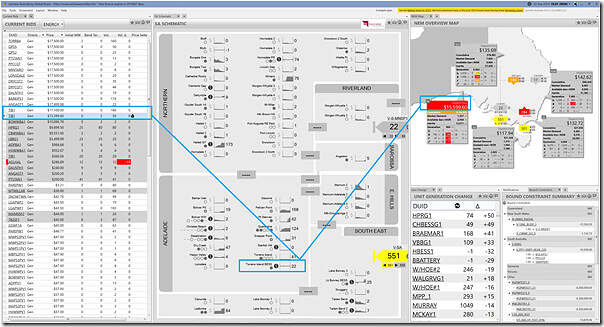
18:20 dispatch interval
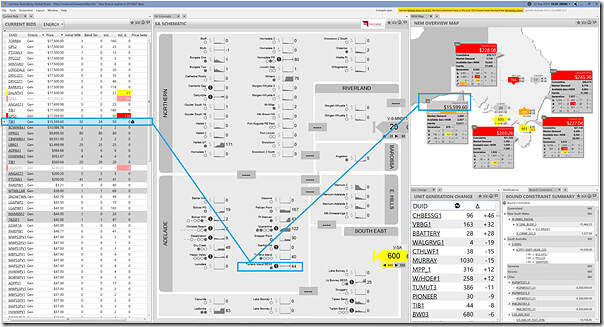
The price increases further – to $15,599.60/MWh (for the first time this evening), with Torrens Island BESS setting the price.
Note that there’s still considerable volume (for BESS and fossil fuelled peakers) above this point – but not many price bands, other than at the Market Price Cap.
18:25 dispatch interval
The price settles in at the same level ($15,599.60/MWh), so with Torrens Island BESS setting the price.
More movement of volume in bid bands seen.
18:30 dispatch interval
The same price outcome and price setter:
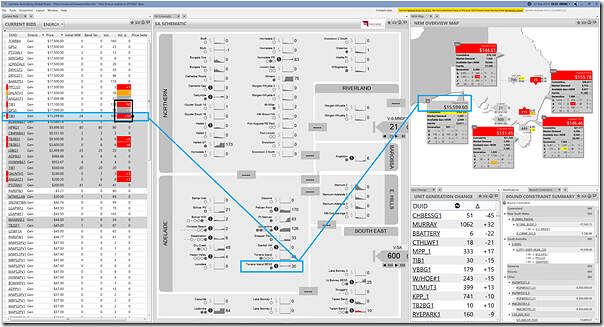
Note the movement of 50MW of volume for QPS5 (at Quarantine peaker) from the MPC bid band down to the $17,099/MWh bid band* – presumably as part of an attempt to get more volume if the price moves higher.
* remember that these bid bands are set at ‘Gate Closure #1‘ the day before – so consider the forethought required to have a bid band only $401/MWh below the MPC!
18:35 dispatch interval
The same price outcome and price setter:
Note, in this dispatch interval, AGL adds 50MW to the ‘Price Setting’ bid band, taking it to 100MW offered at $15,599.60 (of which only 6MW gets a Band Target).
18:40 dispatch interval
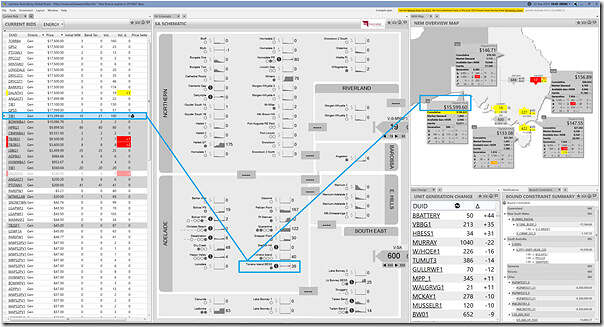
The same price outcome and price setter:
Some small shuffling of volume in bid bands seen.
So that’s where will leave it, in Part 3 of this evolving Case Study about what happened on Monday 23rd September 2024 in South Australia.
Stay tuned for more…


Leave a comment