Paraphrasing some historical figure*, if I had more time I might have written a better explanation … but here goes …
* was it the French mathematician and philosopher Blaise Pascal … or philosopher John Locke, the statesman Benjamin Franklin, the transcendentalist Henry David Thoreau, and the President Woodrow Wilson (I also don’t have time to check)?
Last Thursday evening we noted that ‘VIC1-NSW1 interconnector unable to Target Flow north, on Thursday afternoon-evening 7th November 2024’.
… following from that article, a number of readers expressed their gratitude for helping to clarify the significance of the interconnector limitation.
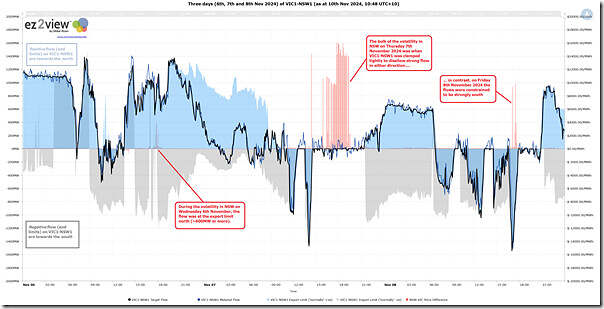
In part because of that, we thought it was probably best to start with this slightly longer (3-day long) view of the VIC1-NSW1 Target Flow, Import and Export Limits, and also the Price Difference between NSW and VIC regions:
Across this three day span:
1) We already noted some brief ‘Early evening volatility in QLD and NSW on Wednesday 6th November 2024’.
… in the chart above, we can see that the few dispatch intervals with a large positive price difference occurred when the interconnector was flowing north at ~+600MW.
2) Thursday 7th November 2024 was a much more significant period of volatility:
(a) With a number of articles already written to discuss various aspects of what occurred, all catalogued here:
… with perhaps more to come (time permitting)
(b) From the chart above we can see that the VIC1-NSW1 clamped tightly so it’s unable to flow much in either direction.
3) We also noted that there was ‘A much shorter run of evening volatility in QLD and NSW on Friday 8th November 2024’
… in the chart we see that the volatile period on this day has flows running very strongly south.
So each of the three days saw periods of volatility in NSW compared to VIC … and on each of the three occasions the VIC1-NSW1 interconnector delivered quite different flow patterns. Constraint Equations, and Constraint Sets, played a significant role in this outcome … and below we’ll start to provide an explanation for this (though will require more than just this article to do it properly).
The role of constraints
With respect to Thursday afternoon/evening we already published ‘Three dispatch intervals (sampled from a long run of volatility on Thursday 7th November 2024) to illustrate the complexity (and significance) of congestion’.
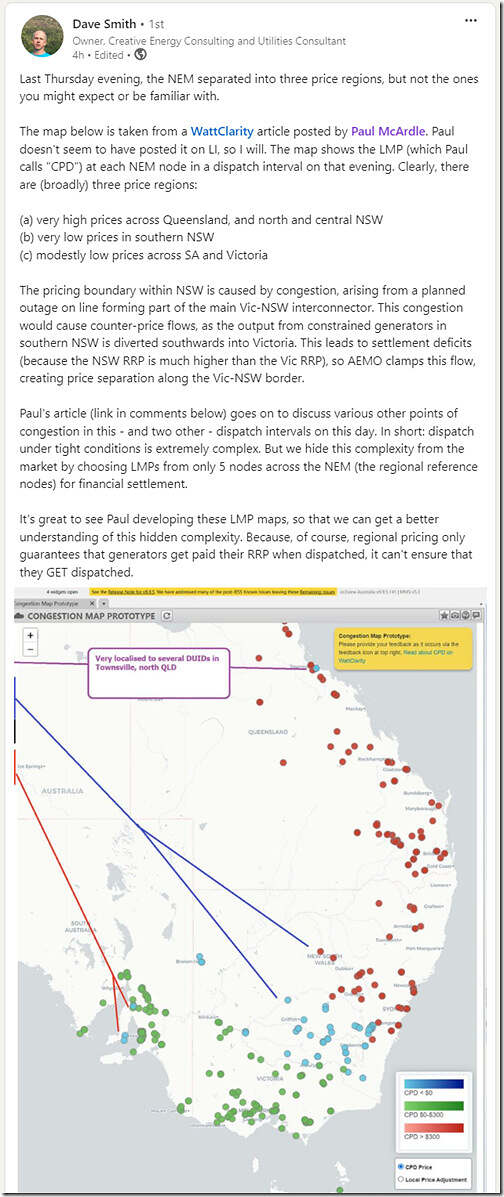
That article has generated some interest – including with Dave Smith’s note here on LinkedIn:
So hopefully this follow-on article (and others to come) will also help…
Some high-level reminders about Explicit Constraints
At any given time the AEMO (via NEMDE) invokes something like ~600 constraint equations to ~1200 constraint equations in order to reflect the state of the network for the dispatch interval in focus.
1) The higher number of constraint equations invoked* occurs during ‘outage season’, when transmission operators take network outages (and generators also have their units on outage at times.
* note that ‘invoked’ is just the fancy NEM time for ‘used’
2) Constraint Equations are always invoked in Constraint Sets
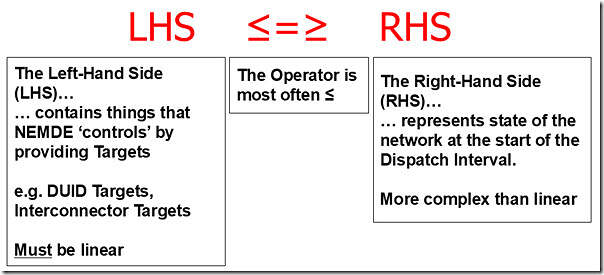
3) The basic form of a constraint equation is as follows:
Why are Readers (here) interested in Constraints?
We know that there’s a diverse bunch of readers of this site – and I’m guessing that different readers might fall into one (or more) of the following categories:
Category 1 might be primarily focused on broader market outcomes … principally interested in why the NSW (and QLD) price was so high for so long?
… perhaps this group might be largest in number, but we don’t really know?
Category 2 will include those who have particular interest in specific assets (such as those that were constrained down across the various regions through these periods) and read articles here to gain some insight in what might have happened to them
… we’ve heard of many instances where articles such as these are handed around internally to help the broader team understand
Category 3 includes those who are interested in these articles to find some tips and tricks to deploy in their own usage of our software.
Category 4 includes those who are more focused on the future – which might be in relation to:
(a) Business development; and/or
(b) Regulatory reforms;
(c) Or something else
Other Categories … and, no doubt, there are those readers who don’t fall neatly into any of the above.
So in writing this article, we’ve tried to include some observations for a cross-section of readers.
The ‘N-MNYS_5_WG_CLOSE ’ constraint set invoked from early Thursday morning
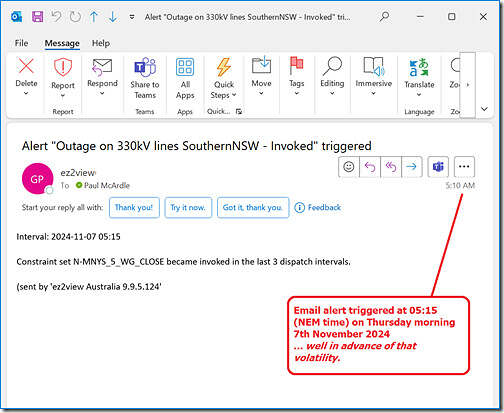
With respect to the challenges with volatility (and constrained megawatts etc) on 7th November, one of the places to start the story might be at 05:10 on Thursday morning 7th November 2024 when a copy of the ‘Notifications’ widget within ez2view triggered this email alert for us, giving us some warning of one of the contributing factors:
Some key points here:
1) Allan’s article ‘What’s happening around Wagga’ provides a good explanation of the challenges relating to the multiple 330kV ‘highways’ connecting Victoria into central NSW.
2) In part because of those issues, ages ago we pre-configured an alert within the ‘Notifications’ widget in ez2view to alert us to any constraint sets becoming invoked that relate to outages on any of these 330kV lines.
(a) Sometimes these network outages pass with minimal fuss
(b) But occasionally (such as on 7th November 2024) they pack a punch.
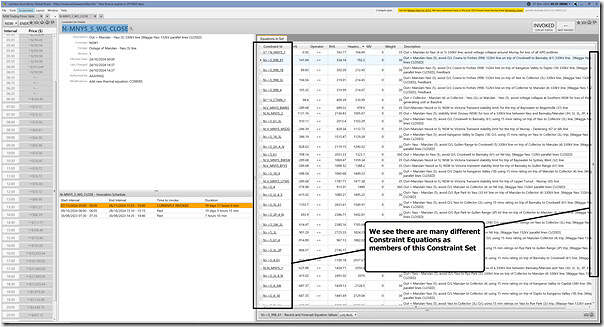
In this case, it’s the ‘N-MNYS_5_WG_CLOSE ’ constraint set that is ‘the culprit’ … but there are other cases documented here where similar issues have arisen because one of the other highways are out of action. Let’s use the ‘Constraint Set’ Details widget for the the ‘N-MNYS_5_WG_CLOSE ’ constraint set to have a quick look at what it’s about, time-travelled back to the 05:10 dispatch interval (NEM time) on Thursday morning:
There’s a few key points here:
1) We see that the ‘N-MNYS_5_WG_CLOSE’ constraint set became invoked in the 05:05 dispatch interval this morning
… hence the email alert
2) Importantly, note that the ‘N-MNYS_5_WG_CLOSE’ constraint set is envisaged to remain invoked out until 16:00 on Tuesday 26th November 2024
(a) That’s over 2 weeks away
(b) a harbinger of more volatility to come, if other conditions are right?
3) The Constraint Set is in place because:
(a) of a network outage… ‘Marulan – Yass (5) 330kV line’
(b) with … ‘Wagga-Yass 132kV parallel lines CLOSED’
4) It contains many different Constraint Equations as members of the Set
(a) any of those might bind in a dispatch interval – each equation having a different effect
(b) with three different Constraint Equations in this set featuring in these ‘Three dispatch intervals (sampled from a long run of volatility on Thursday 7th November 2024) to illustrate the complexity (and significance) of congestion’.:
i. There was the ‘N::N_MNYS_2’ constraint equation bound (at 14:25, 15:50, and 17:55).
ii. There was the ‘N>>5_998_4’ constraint equation bound (at 15:50 and 17:55).
iii. There was the ‘N>>5_998_61’ constraint equation bound (at 17:55).
(c) Remember that we’ve not looked at all the other dispatch intervals
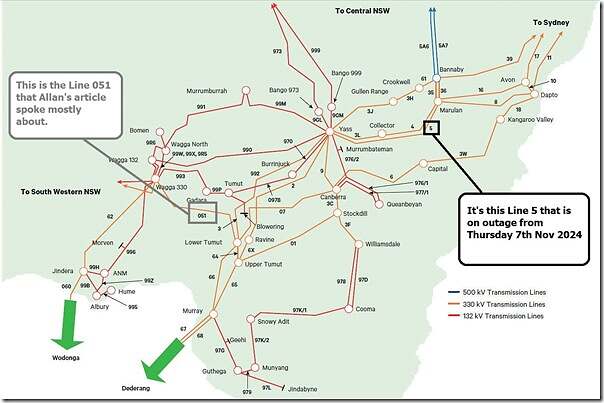
Borrowing the same TransGrid diagram that Allan used in his article, here’s the relevant ‘Line 5, between Marulan and Yass’ highlighted:
Note that Allan’s article was mostly written with respect to the Line 051 (also highlighted above) – for which the concerns are somewhat different. However there are also some broad similarities, in that flow capacity into central NSW from southern NSW is limited – as a result of which the situation is quite different (within NSW) either side of that link:
1) South of Line 5 there’s reduced capacity to get power ‘to market’ … but, because everyone in NSW is paid the RRP, there’s increased desire to be dispatched
(a) which leads to some interesting bidding behaviour – some specifics of which we might look at in a subsequent article, time permitting;
(b) as a result of which the affected unit’s CPD Price drops to –$1,000/MWh (or worse), as they jostle for limited headroom; whist
2) North of Line 5 there’s an increased opportunity to dispatch (because what’s happening further south), and also increased incentive to dispatch (because of the high RRP for the NSW Region).
So we’ll leave this article here for now, as something we’ll be able to refer back to later as we continue to unpick some of what happened on Thursday 7th November 2024 … and also with reference to other events as well.


Re the openining quotation: It may have been Pierre de Fermat on the wonderful proof of his “last theorem” that he’d found but didn’t have space to write in the margin of his notes – ultimately the proof took Andrew Wiles hundreds of pages of extraordinarly abstract concepts that very few humans are capable of understanding. Or perhaps Eugene Galois who scribbled out everything he’d discovered about group theory the night before he died in a duel.